Today based on 0.0.1 Simple SPY Trading System the plan was short-term short. Someone asked me yesterday, what should we do if the market gapped down today? My answer was to wait for the gap being filled at about 10:30am, then watch 2.1.2 NYSE - Tick (5 min) and see if TRIN stayed above 1.2, at the same time $XJY should go up. However today TRIN was quite bearish all the time, and $XJY kept falling. This was against the short signal until the market closed, and a huge Bullish Engulf pattern was formed. Therefore the sell signal was not confirmed today, and we have to wait for the next chance. Concerning the $XJY confirmation, I find that the market will normally close in green if $XJY goes down. This phenomena is valid recently but may not hold forever.
Today we got mid-term buy signal. On 0.0.0 Signal Watch and Daily Highlights needed mid-term signals on the left side of the chart are all in green, including my favorite signal 2.2.0 NYSE McClellan Chart.
As a result of this, 0.0.1 Simple SPY Trading System says it's time to close mid-term short, and open mid-term long. However there are some overbought signals on the chart which means the market is due for pullback. So you have to make a decision whether to close mid-term short and open mid-term long after a pullback OR close short / open long tomorrow morning. For myself, I do not open long positions when the market is overbought. All signals are about probability, TA is not 100% accurate, but the spirit of TA is to bet the high probability setups, not worry about "this time may be different". When I say the market is due for pullback in the near term, I mean the market has a higher probability of pullback than rally. Whenever you believe this time is different and the signals might be wrong, please feel free to go ahead.
1.0.0 S&P 500 Large Cap Index (Daily). Similar with other indices, it is overbought but MACD is confirmed buy signal. Also note the all black buy signal on the bottom of the chart.
1.1.0 Nasdaq Composite (Daily). It is testing the downtrend line.
1.1.6 PowerShares QQQ Trust (QQQQ Daily). It is funny that VXN MA(10) Envelope is oversold. What does this mean? fall further down? At least the upside space is not much.
1.2.1 Dow Jones Industrial Average (Weekly). $INDU is testing back the trendline, which so called kill channel goodbye.
1.2.7 Diamonds (DIA 15 min). The negative divergence of RSI is obvious on the 15-min intraday chart. But take the notice that the divergence does not mean immediate pullback, it usually has to be confirmed by other signals.
2.0.0 Volatility Index - NYSE (Daily). It is extremely oversold. Note that the breakout of MA(10) Envelop is the greatest since the beginning of this year. The probability of the market pullback is very high.
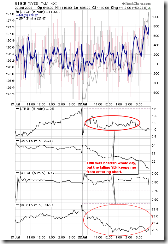
2.4.2 NYSE - Issues Advancing. Overbought on the chart also means pullback. Note that the portion it extends into the overbought region is the greatest in the year, and overbought/oversold of this signal has been fairly accurate in the past. (this time might be an exception, who knows?)
3.3.0 streetTRACKS Gold Trust Shares (GLD Daily). It broke the support, so I closed my position.
3.4.3 United States Oil Fund, LP (USO 60 min). MACD and RSI have a little bit positive divergence.
5.3.0 Financials Select Sector SPDR (XLF Daily). It is right on the Fib 50 line at where the pullback usually finishes. Tomorrow MA(50) will be tested, which is very important.


1 Comment