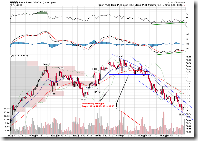
Today we got several mid-term sell signals, and they will be confirmed if tomorrow the selling off continues. Therefore the market is better to go up, and ought to go up dramatically.
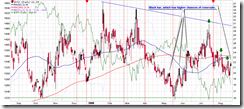
Take a look at the Damage first, just to realize how serious the problem is.
On the following chart, 4 candles in the green circle are 2 days up 2 days down, at the end the two down days didn't claim all the gain during the two up days. This means the upward momentum was stronger than the downward momentum, good. Look at the blue circle, two up days could no longer cover the loss during the two down days, which means the upward momentum was weakened, warning. Let's look at the red circle, the recent two days down is much more violent than the two days up, thus the trend weakening is confirmed, and probably means the trend reversal, bad. Now we would like to see if the market can bounce back for two days, and if the rally can fully cover the loss.
0.0.1 Simple SPY Trading System, the Rising Wedge is broken, however the first fence is still there so far. On the other hand, INDU on 0.0.3 INDU leads the Market has broken the first fence. If you believe that INDU leads the market, very likely SPX and COMPQ will follow.
1.0.6 S&P 500 Bullish Percent Index, BPSPX sell signal. This needs the confirmation from BPINDU and BPCOMPQ though. So tomorrow is critical.
2.2.1 NYSE McClellan Oscillator, sell signal. If it keeps below zero, our principal mid-term indicator, 2.2.0 NYSE McClellan Chart, will give a sell signal.
2.8.0 CBOE Options Equity Put/Call Ratio, downtrend line is broken. Well, you can draw another line, but if tomorrow it goes up further this will be confirmed.
As a summary, the situation is not so good. Unless we get a super big green candle and cover the loss during the past two days, you'd better sell highs instead of buying dip.
Will the market bounce back tomorrow?
The answer is maybe.
2.0.0 Volatility Index - NYSE (Daily), black candle. In the history shown on the chart, the probability of reversal is quite high. It is well know that VIX is a contrarian indicator, if it plunges the market will probably soar.
2.3.0 NYSE High-Low Index, it is very close to oversold. If it goes down tomorrow it may be indeed oversold, and then the probability of rebound on the day after tomorrow will be high.
1.1.6 PowerShares QQQ Trust (QQQQ Daily), this has a high probability of rebound. It has three down days in a row, while three consecutive down days almost never happened since June. Also note that the volume has kept increasing during the past three days. Price down on increasing volume often means oversold, so it has a good chance of rebound tomorrow. 1.3.0 Russell 2000 iShares (IWM Daily) is similar.
1.1.A PowerShares QQQ Trust (QQQQ 15 min), 1.3.6 Russell 2000 iShares (IWM 15 min). On the 15-min charts, MACD and RSI show obvious positive divergence. So they have a chance of rebound.
1.1.4 Semiconductor Holders (SMH Daily), semi is oversold. If it bounces back, QQQQ will be more likely to do the same.
1.0.3 S&P 500 SPDRs (SPY 60 min), 1.2.3 Diamonds (DIA 60 min), RSI is oversold. Take a look at what happened while RSI was oversold like this previously.
1.0.4 S&P 500 SPDRs (SPY 15 min), it looks a double bottom, and the target is 128.
5.0.1 Select Sector SPDRs, the Financial sector XLF, note that the volume pattern of two down days in a row -- if the volume increased on the second day, it means oversold, and on the third day XLF bounced back. Hopefully this time won't be an exception. XLF would better not go further down, today low is the last fence.
1.4.2 S&P/TSX Composite Index (60 min), 1.4.3 S&P/TSX Composite Index (15 min). On the Canada market chart, MACD and RSI show obvious positive divergence. So it will probably bounce back.


