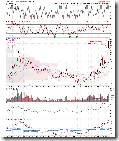
No so much to talk about today. Nothing new but oversold and the market might be due for a rebound should it be rational. I have to admit that those signals that I collected over the time had been very accurate in the past but they don't work very well recently. The problem is caused by the massive selling off from big moneys which are obviously in trouble, nothing can be improved before those big moneys stop selling. The criteria to judge the trend reversal is still the same, whenever the market rises for two days in a row, we start to hope.
What about tomorrow? The market might bounce back.
0.0.2 SPY Short-term Trading Signals. Recent pattern is one up day followed by two down days. Now we have two down days, so tomorrow might be an up day. Furthermore, recent two candles look a bit like bullish inverted hammer, and they stand above Oct 10th low, which means a reversal is possible.
2.4.2 NYSE - Issues Advancing. Note the bold blue curve has entered into the oversold region. In the past NYADV had been quite accurate, the market always bounced back. Recently the timing is a bit off, however note that the rally on Oct 13th happened while this indicator was oversold. This means the overbought of this indicator is more effective than those ones in 2.4.3 Breadth Oversold/Overbought Watch.
3.2.0 CurrencyShares Japanese Yen Trust (FXY Daily). Japanese Yen is overbought, in the recent two days black candles, which often causes reversal, compose a bearish harami. Therefore it might pullback, which is good for rally of the stock market.
1.0.3 S&P 500 SPDRs (SPY 60 min). It is still a descending triangle, and today SPY has touched the support fore three times which is considered as a confirmation. If tomorrow SPY rises and sells off eventually, then test the support for the fourth time, the support will likely break. Of course, the breakout of descending triangle is bidirectional, we cannot rule out the possibility of breakout at the up side.


4 Comments