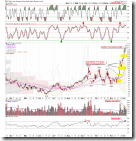
Today the market dropped down, but it doesn't look so bad, at least it is bears' turn to show their strength. Two up days versus two down days, if tomorrow low cannot break Monday low, the strength of bears will be approved to be weak. In another words, as long as the Monday low holds, still the bounce is alive. Will the Monday low hold? Possibly, because the TICK today was too negative, and Yen and Bond were too high. It is hard to imagine how high these two things could fly, and it is reasonable to doubt if the selling off will test the November low.
0.0.2 SPY Short-term Trading Signals. The pattern looks a bit like symmetrical triangle, and 75% of chance is break out at the upside. Note the green dashed line, once TICK closes below -1000, the possibility of bouncing back on the next day is very high. Of course, the market may dip down sharply first and reverse during the day.
2.1.2 NYSE - TICK (30 min). Note the blue bold line, which happens when it reaches the green horizontal line? The worst scenario is to sell off further until the blue line forms a double bottom or positive divergence. Just for clarification, I doubt the potential selling off but by no means the market could bounce back immediately.
3.0.3 20 Year Treasury Bond Fund iShares (TLT Daily). Take a look at this chart, unbelievable.
3.2.0 CurrencyShares Japanese Yen Trust (FXY Daily). Almost a new high, it is overbought.
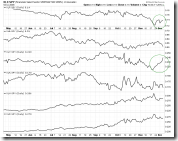
5.0.1 Select Sector SPDRs. Recently XLY and XLF are strong. It is good that the past losers are becoming stronger. Does anyone believe the rally of XLY and XLF was caused by short squeeze? If no short squeeze, the strength is real.
6.0.3 Sector Relative Strength. For more information, take a look at the relative strength.


6 Comments