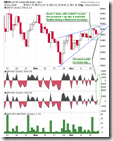
Although SPX went up a bit on Friday, SPY dropped down. On the chart, three down days didn't take off the rally on Tuesday, so the dip is a buy according to 8.1.1 Buyable Pullback Rule. Suppose anything unexpected happens, the cut loss is below Dec 12th low at about 850. And the last hope of bulls is below the Dec 1st low at about 815. There is no concrete sign to indicate whether the market goes up or down on Monday, and my guess is the probability of 4 down days is pretty low since there are only two cases of three down days in a row since Oct 10th, and INDU and NYA have been down for three days. Furthermore, the next two weeks are shorter than normal, so will be the volume, if the big moneys want to distribute they won't get a good price, so the probability of big selling off is very low.
Take a look at the following SPY 60-min chart, the chart pattern looks quite bullish, SPX broke the head and shoulders bottom and then back tested neckline, finally it took off and formed an ascending triangle. Ascending triangle usually means continuation, and the probability of going up is higher. Of course it could break out at the downside, in this case there are two important levels where you can either cut loss or short the market.
7.0.3 NYSE Composite Index Breadth Watch. The Friday down is actually not very weak, the breadth is positive. This circumstance is the first time during the recent several months. Additionally, 1.3.7 Russell 3000 Dominant Price-Volume Relationships, surprisingly, 1443 stocks price up volume up, which is the most bullish among four price-volume relationships. The conclusion is no conclusion, just interesting.
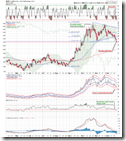
2.0.0 Volatility Index (Daily). This chart could be either bullish or bearish from different perspectives. It is oversold, and ENV20 is almost broken, so VIX might bounce back up in the short term which favors bears. However the big pictures is that double top is confirmed -- because the neckline is not very clear, it might not be broken strictly speaking. My thought is bullish, according to my experience once a pattern is broken the overbought/oversold signals will not matter and VIX may continuously drop down.
2.3.4 Nasdaq Total Volume/NYSE Total Volume. This looks bullish to bulls, but it should not be over-considered because Friday was option expiry day.
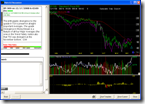
Here is T2123 of Telechart, which is the accumulation of 4 week new high - 4 week new low and reflects the market strength. Although the market dropped down for three days but green line was going up, which indicates that 4 there were more and more week high. One can also see that the market is decent when green line crosses above the brown lines. Compare with up-crossing in August, the brown line is very close, and the rally was over very soon.
Here is analysis from a few newsletters.
Based on awarded Money Stream and TSV, Don Worden in Telechart is optimistic to the market.
Analysis of Mian Line Investor:
Analysis of Arthur Hill:
VIX analysis by Mike Paulenoff:


2 Comments