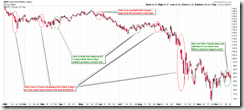
During the past seven days there are five days when the market went down but there is still no low low, so the bounce still alive, and 8.1.1 Buyable Pullback Rule is still valid. TA is a matter of probability, and I validated all signals that I present in the report and they worked in the past, which is by no means guaranteed to work 100% accurate in the time being. If the signals are wrong, I will cut loss when SPX closes below 850. On the following chart, you may study if the rule in 8.1.1 is still valid. Because all short-term signals are neutral, I have no idea whether the market will go up or down. I guess the probability of going further down is low, because it's rare to see five consecutive down days even in this year. Again, it's a matter of probability and I would like to avoid saying "this time might be different".
1.0.3 S&P 500 SPDRs (SPY 30 min), a little bit positive divergence. RSI and STO could go further up assuming they bounced back up from oversold level, so it's possible that the market could rally as soon as it opens, further down is also possible and that will form a low low, and RSI will form higher low. The so called rebound after positive divergence means the market goes down in the morning and reverses during the day.
2.8.1 CBOE Options Total Put/Call Ratio. This signal is way too bullish. However according to my observation the market may not sell off immediately after CPC reaches very low, and it could go up for a few days, which can be seen on the green curves represented by the market at the locations of green vertical dashed lines.
2.0.0 Volatility Index (Daily). VIX is still oversold, and it is going down with the market, now I am unclear what the consequence is.


4 Comments