| Trend | Momentum | Comments - Sample for using the trend table. Warning: This is NOT a trading recommendation! | |
| Long-term | Down | Idea for trading intermediate-term under primary down trend. | |
| Intermediate | Up | Overbought | Hold long. |
| Short-term | Down* |
| Report Focused On | Buyable dip or the market topped? |
| Today’s Summary | CPCE is in danger of signaling an intermediate-term top if further rise tomorrow. 2 days left for bears to prove themselves. From now on the game may become "buy dip and sell bounce". |
2.8.0 CBOE Options Equity Put/Call Ratio. Double confirming line is at risk of being broken out should it rise further, which means an intermediate-term top. This signal, so far, has never disappointed me.
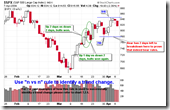
7.1.0 Use n vs n Rule to Identify a Trend Change. If SPX goes below 780 within two days, the uptrend will be changed, otherwise it may be a buyable dip. Why? 4 vs 4, the one wins dominates the prevailing trend. You may refer to 8.0.3 Use n vs n Rule to Identify a Trend Change 2008 for further information. What about if the market rises? If the MACD at the bottom of 1.0.3 S&P 500 SPDRs (SPY 30 min) gives a buy signal, one could possibly try to buy dip because the intermediate-term trend is still up according to the trend table, and the buy signal of the short-term MACD would be more reliable.
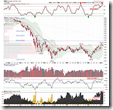
Institutions Buying and Selling from www.stocktiming.com. Note that when the blue curve starts to seesaw, NYA index will do the same instead of no-pullback-rally like what happened in the previous several weeks. Of course, it is not wise to short the market at all expense before the red curve denotes the distribution rises beyond the blue curve denotes the accumulation. This means that the game we could play, in the following days, would be to buy dip and sell bounce.
1.1.4 Nasdaq 100 Index Intermediate-term Trading Signals. STO and ChiOsc are still overbought and pullback is still needed in the short term.
1.0.4 S&P 500 SPDRs (SPY 15 min). The pattern could be a bullish falling wedge, and I don’t rule out the possibility of bounce back up tomorrow.
3.4.2 United States Oil Fund, LP (USO 30 min). This looks like a bullish falling wedge too, which is good for the broad market.
By the way, today both SPX and VIX dropped down. Please read my article When both SPX and VIX drops to understand that it’s actually relatively bullish.


13 Comments