| Trend | Momentum | Comments - Sample for using the trend table. Warning: This is NOT a trading recommendation! | |
| Long-term | Down | Idea for trading intermediate-term under primary down trend. | |
| Intermediate | Up | Overbought | Beware of $NYA50R which usually means a top |
| Short-term | Up | Neutral to overbought* | May need take profit if further up tomorrow |
| Report Focused On | Buyable dip or the market topped? |
| Today’s Summary | CPC < 0.8, 64% chances the market will close in green tomorrow. Too many negative divergences, at least don’t chase high here. |
Nothing new today, just too many negative divergences, so I still expect to see a decent pullback soon. Because CPC is below 0.8, according to 7.0.4 Extreme CPC Readings Watch, 64% chances the market will close in green tomorrow. However, the market is a little bit overbought in the short term, so it’s prudent to take profit if the market does go up tomorrow.
7.3.2 Firework Trading Setup. The firework has been going on for two days. For your reminder, two conditions can terminate this setup: 1% or greater gap down open, or CPC < 0.7. The criteria for taking profit is the overbought of NYADV. Now the profit taking criteria is met, although in the past NYADV could stay at overbought for several days, but I don’t think it could still do so now, so again, take profit if the market goes up tomorrow.
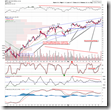
1.0.2 S&P 500 SPDRs (SPY 60 min). This is my major concern, bearish rising wedge plus lots of negative divergences. The way to correct this is either big rally or big sell off. Since the market is extremely overbought over the intermediate term, a big rally for correcting all those technical bearish signs is rather unlikely in my opinion.
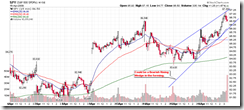
1.0.4 S&P 500 SPDRs (SPY 15 min). Here is one more bearish rising wedge in a very short-term. I don’t mean the market should drop right away though, just for your references.
Intermediate term there are lots of negative signs, although they cannot tell us exactly when the market will be topped, but from TA terminology, risk vs reward now favors the risk side. Therefore the suggestion is not to chase high here before a pullback.
0.0.3 SPX Intermediate-term Trading Signals, 1.1.4 Nasdaq 100 Index Intermediate-term Trading Signals, overbought plus lots of negative divergences.
SPX Breadth from www.sentimentrader.com. Note the negative divergences. The number of stocks close above MA50 at the very bottom is equivalent to NYA50R, which I’ve been mentioning, usually is a sign of a market top.
Indicators at extremes from www.sentimentrader.com. I mentioned this chart in the weekend report, for all the indicators provided by www.sentimentrader.com, bearish signals are way more than bullish signals and the spread between them has reached an extreme which in the past always was a market top.


9 Comments