| Trend | Momentum | Comments - Sample for using the trend table. Warning: This is NOT a trading recommendation! | |
| Long-term | Down | Idea for trading intermediate-term under primary down trend. | |
| Intermediate | Up | Neutral | According to $NYA50R, the market might be topped. |
| Short-term | Up | Neutral |
| Report Focused On | Buyable dip or the market topped? |
| Today’s Summary | Still expect the SPY’s 5th gap to be filled soon. Don’t chase high if Monday is up again. |
Nothing new today, 5 unfilled gaps on SPY and lots of negative divergences are still concerns to me, so I won’t add long positions at this level. Either bulls or bears have no clear edge on Monday. Should the market gap up on Monday, however, I doubt if the 6th gap could still hold, therefore probably bears are safe at the moment.
The biggest edge of bulls on Monday is the seasonality from www.sentimentrader.com, the 2nd trading day is statistically the most bullish trading day in May.
OK, bears seem to have a lot of edge now. But don’t forget the trend table, both intermediate-term and short term are still up. One should be extremely cautious while trading against the trend.
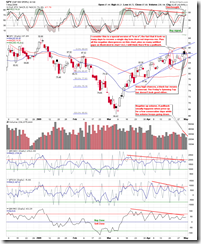
1.0.2 S&P 500 SPDRs (SPY 60 min), this looks very bearish to me. I still think that before the 5th gap gets filled, bears have nothing to worry about.
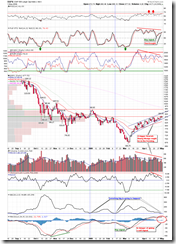
0.0.2 SPY Short-term Trading Signals, many negative divergences favor the odd of downside movement. Especially if considering the rally since Apr 20th as an up swing, it looks like that bulls just get back where they were before the Apr 20th, so they are not, at least as strong as before.
0.0.3 SPX Intermediate-term Trading Signals. Note the contraction of the BB width at the bottom of the chart. Something is going to happen, either big up or down. I bet on the downside because overbought plus negative divergences, so it’s hard to believe the market could go up substantially.
SPY breadth from www.sentimentrader.com.
T2103 from Telechart, Zweig Breadth Thrust, now you should feel more confident about the accuracy of the overbought of this indicator. Maybe the overbought on Friday is not at extreme, however if the market goes up on Monday, it will very likely turn around on Tuesday. Again, don’t chase high if the market goes up on Monday.
T2121 from Telechart, 13 Week New High/Low Ratio, overbought must be corrected.
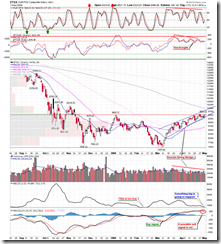
1.1.1 Nasdaq Composite (Weekly), it is very impressive that COMPQ has rallied for 8 consecutive weeks. Now RSI has reached a critical level.
2.8.2 Normalized CPCI:CPCE, remind you that CPCI spikes up again.
5.0.1 S&P Sector SPDRs. Friday rally was led by the breakout in the energy sector, while the financials sector was lagging behind.
Now take a look at the following inversed correlation between XLE and XLF. If the breakout of XLE on Friday means XLE starts to outperform, this will be bearish to the overall stock market because SPX tends to follow XLF.
7.4.0 S&P/TSX Composite Index (Daily), 7.4.1 S&P/TSX Composite Index (Weekly). The daily MACD and weekly STO on the Canadian market index have given a sell signal. However I think bears should not rush in at the moment because the possibility of energy sector outperform is actually a good news to TSX which is dominated by energy.


19 Comments