| Trend | Momentum | Comments - Sample for using the trend table. Warning: This is NOT a trading recommendation! | |
| Long-term | Down | Idea for trading intermediate-term under primary down trend. | |
| Intermediate | Up | Overbought* | According to $NYA50R, market might be topped. |
| Short-term | Up | Overbought* |
| Report Focused On | Buyable dip or the market topped? |
| Today’s Summary |
Bears beware of possible reduced effects of overbought signals. Expect a turnaround Tuesday. |
I don’t know if you remember that for awhile the “Momentum” column in the above trend table were “neutral”, therefore from chart 0.0.2 SPY Short-term Trading Signals, we can see during that period the market seesawed. Today, however, the trading range was broken on the upside and we now have “overbought” listed in the “Momentum” column. I have an impression that once a range was broken, the overbought/oversold effects will be greatly reduced, so from now on, pay attention to the “Momentum” column, if it keeps having “overbought” while the market simply consolidates in a small price bar after each big up day on daily chart, bears must be careful that the market may have another round of push up. By the way, if we do get another round of push up, the negative divergences seen on lots of charts may get corrected.
1.0.2 S&P 500 SPDRs (SPY 60 min), I still don’t believe that the SPY can hold 6 gaps and even has the 7th gap, so I dare not add long now, I’ll wait for “at least a minor” pullback before deciding what to do next. Please pay attention to the word “at least a minor”, as described above I’m generally losing confidences on “overbought” signals after a trading range breakout. LOL
Tomorrow, I expect a turnaround Tuesday.
2.8.0 CBOE Options Equity Put/Call Ratio, although CPC < 0.8 which according to 7.0.4 Extreme CPC Readings Watch, there’re 65% chances that the market may close in green tomorrow, but since CPCE today reads only 0.54 and from the chart, we can see if the CPCE becomes too bullish, the next day wasn’t very pleasant.
T2103 from Telechart, Zweig Breadth Thrust, as mentioned in the weekend report, it gets overbought today and its overbought signal is very accurate.
T2121 from Telechart, 13 Week New High/Low Ratio, mentioned in the weekend report too, too high, should be corrected soon.
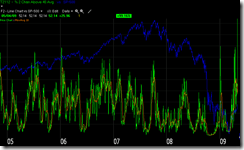
T2112 from Telechart, % stocks trading 2 standard deviation above their 40-day moving average, I suspect that maybe there’s a data error here, too many stocks too far away from MA40.
3.0.3 20 Year Treasury Bond Fund iShares (TLT Daily), Just to show you a possible Bullish Tri Star. It’s not another excuse I found (as listed above) to talk you into believing that we’ll have a pullback tomorrow. LOL


15 Comments