| Trend | Momentum | Comments - Sample for using the trend table. Warning: This is NOT a trading recommendation! | |
| Long-term | Down | Idea for trading intermediate-term under primary down trend. | |
| Intermediate | Up | Overbought | According to $NYA50R, the market might be topped. |
| Short-term | Up | Overbought |
| Report Focused On | Buyable dip or the market topped? |
| Today’s Summary | Expect market continue to pullback tomorrow. |
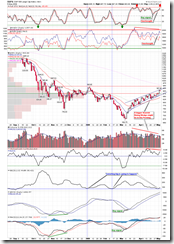
Today both SPX and VIX dropped down. The similar situation happened four times recently, every time on the next day the market closed in green. However CPC is below 0.7 now and this happened six times, while five times the second day market closed in red. Considering the market is still overbought and the seasonality statistics, I tend to believe the market may pullback further tomorrow. However if the market does close in red tomorrow, be reminded that SPX has never closed in red for more than two days in a row since March.
7.0.7 SPX and VIX Divergence Watch. This supports the market going up tomorrow.
2.8.1 CBOE Options Total Put/Call Ratio. This supports the market going down tomorrow. Furthermore, because CPC < 0.7, the firework trading setup should has finished today according to 2.8.3 SPX:CPCE.
1.0.2 S&P 500 SPDRs (SPY 60 min). There are still six gaps, still overbought and negative divergence, therefore still I dare not add any long positions.
T2103 from Telechart, Zweig Breadth Thrust, still overbought.
T2121 from Telechart, 13 Week New High/Low Ratio, rallied again and still due for a pullback.
T2112 from Telechart, % stocks trading 2 standard deviation above their 40-day moving average, still too many stocks deviated from MA40, although it has been corrected a bit today, it is still a multiple-year new high.
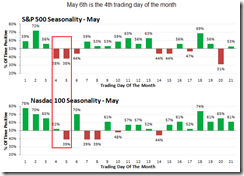
Seasonality from www.sentimentrader.com, the following two days are probably the most bearish days in May.
2.0.0 Volatility Index (Daily). Note STO and MA ENV, VIX may bounce back up which is bearish to the stock market.
OK, now something about “useless” TA as I’ve been repeatedly hearing.
0.0.3 SPX Intermediate-term Trading Signals. This chart is prefixed with “0” in my chart book and considered as one of the most important charts. If you simply follow the MACD or NYSI on the chart, you may pocket the profit from the very beginning to the very end. This is so called Let the market go first. Well, I’m merely a human so I did a few attempts of running before the market and yes, got burnt several times, but fortunately, I always leave some fund for letting the market go first. Trend following indicators such as MACD and momentum indicators such as STO are designed for different market conditions, there is no single indicator which covers everything.
7.3.1 Simple SDS Trading System. This chart has been working pretty well in the past, now it says to buy SDS which means to short the market. OK, tough question here: WILL YOU FOLLOW? You are scared, aren’t you? What I am trying to say is there is no 100% guaranteed indicator, you have to rely on good trading strategy and long term success rate to win the game. Think about how many people dared to long when MACD on chart 0.0.3 gave a buy signal on Mar 12?


18 Comments