| Trend | Momentum | Comments - Sample for using the trend table. Warning: This is NOT a trading recommendation! | |
| Long-term | Down | Idea for trading intermediate-term under primary down trend. | |
| Intermediate | Up | Overbought | According to $NYA50R, market might be topped. |
| Short-term | Up | Overbought |
| Report Focused On | Buyable dip or the market topped? |
| Today’s Summary |
64% chances the market may close in green tomorrow. |
Well, if the market keeps going up like now, I’d soon be out of this “blog business”, because the only thing I could write every day is: “overbought, but please discount all these overbought signals.” LOL. In 05/04/2009 Market Recap: Breakout!, I mentioned that the overbought signals should be discounted once a breakout occurs. So from now on, if I have to mention “overbought” everyday, please take it with a grain of salt. Again, the most important thing in trading is to try best not to trade against the trend.
7.0.4 Extreme CPC Readings Watch, CPC < 0.8 today, which means 64% chances the market may close in green tomorrow. Also because of CPC < 0.8, according to chart 2.8.3 SPX:CPCE, the firework trading setup was triggered.
2.8.0 CBOE Options Equity Put/Call Ratio, if indeed the market closes in green tomorrow, then most likely it will pullback on Friday. The reason: if CPCE keeps dropping tomorrow then it will drop bellow the horizontal red line which has consistently caused an unpleasant day the next day; while if CPCE rises tomorrow then it will likely break the blue trend line which could also trigger a pullback.
There’re too many overbought signals which I almost mention them every day, so today I’ll just list the best of them.
T2112 from Telechart, % stocks trading 2 standard deviation above their 40-day moving average, this is a record high in Telechart. From my experiences, the best overbought/oversold signals are those extreme deviations from the moving average, so at least short-term I still expect a pullback.
T2103 from Telechart, Zweig Breadth Thrust, I trust this one very much.
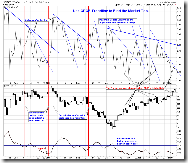
For other signals, Indicators at extremes at www.sentimentrader.com says a lot today: For all the signals provided by www.sentimentrader.com, there’s no single bullish signal today (see green curves, reads 0 now), while the spread between the bearish and the bullish signals has again reached an extreme level (see dashed red curves on the bottom of the chart) which for the past 4 times has all successfully pointed out a market top.


13 Comments