| Trend | Momentum | Comments - Sample for using the trend table. Warning: This is NOT a trading recommendation! | |
| Long-term | Down | Idea for trading intermediate-term under primary down trend. | |
| Intermediate | Up | Overbought | According to $NYA50R, market might be topped. |
| Short-term | Up | Neutral* |
| Report Focused On | Buyable dip or the market topped? |
| Today’s Summary |
No idea about tomorrow just a few speculations about potential further pullback. |
Up or down, no idea about tomorrow. The pullback today has corrected all the short-term overbought signals so it’s actually good for bulls. Now the question is whether the pullback could last for a few days? I don’t have any solid proof but two (perhaps wishful) speculations, so simply read them for fun.
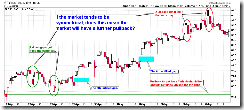
0.0.2 SPY Short-term Trading Signals, this is the 3rd reversal day so far, while the previous 2, as illustrated on the chart failed to reverse the trend, so the question is: Is the 3rd time the charm?
From the chart bellow, we can see SPY had 2 BIG down gaps before and got filled right on the same day which strongly expressed its unwillingness to go down and thereafter SPY kept going up without virtually any pullback. Now we had 2 BIG up gaps and got filled right on the same day which, at least to me, strongly expressed its unwillingness to go up. If indeed the market tends to be symmetrical (like we always see from the mother nature), does this mean that it would pullback exactly the same amount?
So the conclusion is that maybe bears still have hopes, especially because SPY has 6 unfilled gaps and for the recent 2 days the SPY has showed us its unwillingness to hold the 7th gap. So it seems pretty reasonable to expect that at least SPY to fill its 6th gap before going further up. Hmm, a question for you: if the market gaps up again tomorrow, do you still expect that gap to be filled on the same day? The tough part is here: That’ll be the 3rd gap up open and because the 3rd time is the charm, so... Well, I don’t know. LOL
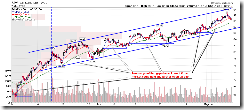
A few interesting charts bellow, just have a quick look.
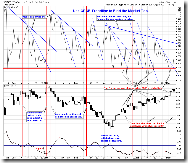
2.8.0 CBOE Options Equity Put/Call Ratio, this argues a short-term top. But since it’s been wrong 2 times recently, I’m not sure if it tells the truth or not.
3.4.1 United States Oil Fund, LP (USO Daily), STO plus the black bar which has very high chances of being a reversal pattern, so oil might pullback.
5.3.0 Financials Select Sector SPDR (XLF Daily), I see multiple resistances ahead.


14 Comments