Summary:
Expect at least a short-term pullback staring as early as tomorrow.
A Head and Shoulders Top could be in the play.
| Trend | Momentum | Comments - Sample for using the trend table. | |
| Long-term | Down | Idea for trading intermediate-term under primary down trend. | |
| Intermediate | Down | Neutral | |
| Short-term | Up | Neutral |
Short-term, SPX might have not much room left on the upside, even it has already turned down.
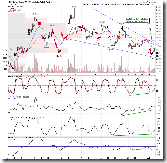
1.0.2 S&P 500 SPDRs (SPY 60 min), quite a few reasons on this chart.
1. A strong resistance area ahead formed by 10 trading days long consolidation.
2. Today is the end of 13 trading day cycle therefore it could be a turn date.
3. Bearish Rising Wedge.
4. Lots of negative divergences.
5. 8 unfilled gaps.
6. The rebound hit exactly Fib 61.8.
3.1.1 PowerShares DB US Dollar Index Bullish Fund (UUP 30 min), Bullish Falling Wedge plus lots of positive divergences, US$ could rebound which is not good for the stock market.
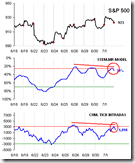
Intraday model from www.sentimentrader.com, overbought.
Intermediate-term, a Head and Shoulders Top could be in the play.
0.0.2 SPY Short-term Trading Signals, so far SPY stalled under MA20, 2 days up were on decreased volume while the only 1 down day was on increased volume.
7.7.9 Russell 3000 Dominant Price-Volume Relationships, this proves the above mentioned up on decreased volume scenario: Both Monday and today had 12xx stocks price up volume down.
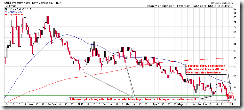
2.0.0 Volatility Index (Daily), 3 reversal bars in a row, if the candlestick pattern is of a little little use, VIX should rebound now, this is not good for the stock market.
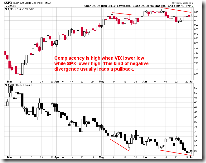
Also don’t forget, VIX had another new low today, this is a negative divergence.


18 Comments