Summary:
Market could be bottomed, a weak pullback would convince me so.
Could be a pullback tomorrow.
| Trend | Momentum | Comments - Sample for using the trend table. | |
| Long-term | Down | Idea for trading intermediate-term under primary down trend. | |
| Intermediate | Down | Neutral | |
| Short-term | Up | Overbought* |
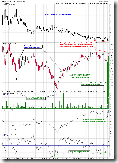
Is the market heading to a new high? Frankly, I don’t know. The weekend report drew “not bottomed” conclusion from 8.0.1 Use NATV/NYTV to catch the market top/bottom, 8.0.6 Use NYTV to catch the market top/bottom and 7.0.9 NYADV and NYUPV Divergence Watch. But on the second thought, they cannot exclude the possibilities that the market is still in a topping process, i.e. the market hasn’t started to drop yet, the previous one month pullback could just be a bigger pullback in an uptrend. The following chart put together all factors arguing that market could be bottomed. It looks like that the bears only hope now is “SPX and VIX negative divergence”, the market is repeating exactly what happened last Aug (chart posted below for your convenience). Personally I’ll wait for the pullback to see if I could ideally apply “N vs N” rule on the pullback, such as “down 2 days couldn’t even recover the bull’s 1 day advance”, to confirm that indeed the market was bottomed.
Is it possible that there won’t be any pullback at all? Well, take a look at 7.6.0 SPX Cycle Watch (Daily), every time a 4 to 6 days huge rebound after the market bottomed, with no exceptions that they were followed by a pullback. The worst was that I kept yelling overbought for several days but the market simply slapped me on the face every day, but eventually, I was always able to say “told you so”. LOL. Today, I see a few reliable overbought signals, so I’m willing to take the risk of being slapped right on the face again tomorrow, by bravely claiming here that I expect a pullback tomorrow. (drum please…)
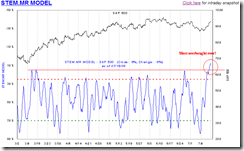
Short-term Model from www.sentimentrader.com, highest ever.
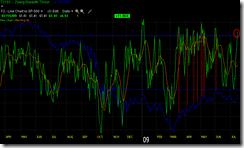
T2103 - Zweig Breadth Thrust from Telechart, the overbought signal is fairly reliable.
0.0.2 SPY Short-term Trading Signals, STO and RSI are all at an extremely overbought level plus the NYADV overbought below is quite reliable too.
The After Bell Quick Summary has discussed reasons for closing red or green tomorrow, considering the above mentioned overbought signals, so the possibility of a pullback should be a little higher tomorrow.
Two bullish charts for your info. Bottom line, short-term is way too overbought, so if there’s no pullback, I won’t chase high here.
7.3.2 Firework Trading Setup, CPC < 0.8, a “firework” was triggered today.
1.0.2 S&P 500 SPDRs (SPY 60 min), could be an Island Reversal formed, target $95.12.


20 Comments