Summary:
Changed long-term trend from down to up, also explained the criteria for setting the trend table.
Could see a pullback early next week.
A few charts giving bears some hopes but they're not guaranteed to work, need to keep monitor them.
| Trend | Momentum | Comments - Sample for using the trend table. | |
| Long-term | Up* | ||
| Intermediate | Up | Overbought | |
| Short-term | Up | Neutral |
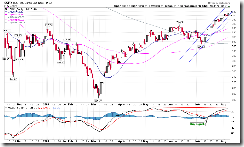
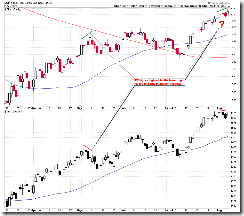
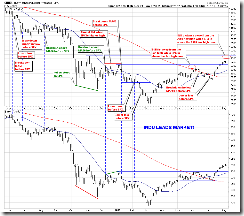
In the trend table, I’ve changed the long-term trend from down to up, because weekly EMA13 had a bullish crossover EMA34. In order to avoid “bias”, so I simply use trading signals as the criteria to mark “up or down” in my trend table. The following 3 charts are what I use to set the long-term, intermediate-term and short-term trend accordingly.
7.3.0 SPX Long-term Trading Signals.
0.0.3 SPX Intermediate-term Trading Signals.
1.0.3 S&P 500 SPDRs (SPY 30 min).
Well, since they are simply signals, so there’s no guarantee whether they'll work or not this time, PERIOD.
I tend to believe we’ll see a pullback early next week. As mentioned in the After Bell Quick Summary that we might see a red Monday, in addition, 1.0.2 S&P 500 SPDRs (SPY 60 min) shows too many too big negative divergences, besides the 7 and 13 trading day cycle was due on Friday (see vertical lines), so it’s possible that Friday was a turning day. For the longer history of 7 and 13 trading day cycle please refer to chart 7.6.1 SPX Cycle Watch (60 min), the cycle worked not bad in the past.
There’re a few other charts supporting my view for a short-term pullback. Just these charts usually don’t work immediately and also may be “fixed” if the market keeps going up. So these charts are to be monitored.
As mentioned in Thursday repot, SPX new high while NDX didn’t. This is a negative divergence and if the May case repeats, we’ll see a little bigger pullback. On Friday, this kind of divergence became even bigger.
Since I mentioned a possible “Nasdaq leads market”, a reader asked what about my so called “INDU leads market”? Here is the chart: 1.2.0 INDU Leads Market, SPX break above Nov 2008 high, but INDU so far hasn’t confirmed it.
3.1.0 PowerShares DB US Dollar Index Bullish Fund (UUP Daily), US$ rose sharply with huge volume on Friday. I think we need to pay attention here, if it’s not an one day wonder then US$ might be bottomed which means a pullback for commodity and commodity related stocks and therefore is not good for the stock market. 3.1.2 PowerShares DB US Dollar Index Bullish Fund (UUP 30 min), by the way, Monday, we may have a chance to verify if the Friday’s US$ rally is an one day wonder or not. Because RSI overbought, if US$ pulls back big on Monday like what it did before whenever RSI was overbought, then most likely the Friday’s US$ rally was only an one day wonder.
5.0.5 S&P Sector Bullish Percent Index I (Weekly), 5.0.6 S&P Sector Bullish Percent Index II (Weekly), I’ve put all the bullish percent indexes that are overbought into below chart. Pay attention to NYSE and Tech, they’re very close to (or already at) a record high now.


17 Comments