Summary:
Pullback target could be around SPX 930ish.
A few signs to watch to confirm more pullbacks ahead.
Could be a rebound at least tomorrow morning.
| Trend | Momentum | Comments - Sample for using the trend table. | |
| Long-term | Up | ||
| Intermediate | Down* | Neutral | Intermediate sell signals still need further confirmation. |
| Short-term | Down | Neutral | |
| My Emotion | Down* |
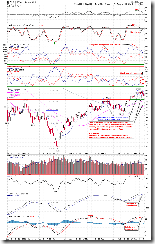
0.0.3 SPX Intermediate-term Trading Signals, a breakdown from the consolidation area today!
- Technically speaking, the longer the consolidation the bigger the drop once breakdown. Because it took exactly the same 9 days as that of June before breakdown, so I think we could assume that the magnitude of the pullback could equal to that of the June, so accordingly the calculation is that the target happens to meet the Fib 23.6 minimum retracement which is around 931.
- Because both NYSI and MACD sell signals were triggered, plus that NYSI sell has already confirmed by NAIS (see 7.3.7 NYSI Trading Signals), so today I downgraded intermediate-term to down from up。
Another possible target: 1.0.3 S&P 500 SPDRs (SPY 30 min), the text book target for Complex Head and Shoulders Top is around SPX 970.
Strictly speaking, the above mentioned target is merely a speculation, therefore I need watch the following charts for a further confirmation.
7.1.0 Use n vs n Rule to Identify a Trend Change, 2 vs 2, it confirmed that bears won AGAIN. There’ll be another chance to confirm tomorwo: Will SPX rebound huge like what it did before, 3 TIMES?
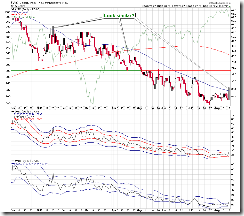
2.8.0 SPX:CPCE, this is so called my 100% correct signal, breakout the green trend line means a top. Pay attention to the green dashed lines, the last 2 times it failed to call the top because there wasn’t any confirm the next day. So this time, in order to convince me that indeed we’re topped, the trend line shouldn’t be broken tomorrow.
2.0.0 Volatility Index (Daily), the big bar feels like a market bottom? We’ll see.
7.1.3 Major Accumulation/Distribution Days, today is a Major Distribution Day, so there'll be at least another Major Distribution Day to come unless a Major Accumulation Day steps in to cancel this curse. Let’s wait and see.
Again, all mentioned above are for a little bit longer term. The bottom line, there’s no evidence yet to say that this is a buyable dip, so be careful buying this dip. Also bounce seller should pay attention to the above mentioned “confirmation needed” charts.
Tomorrow, I expect a green close, at least a rebound in the morning. Besides the simple statistics mentioned in the After Bell Quick Summary, I have 3 additional excuses below:
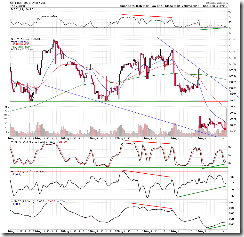
1.0.4 S&P 500 SPDRs (SPY 15 min), a few positive divergences, this is the main reason I expect a rebound tomorrow morning.
3.1.0 PowerShares DB US Dollar Index Bullish Fund (UUP Daily), black bar means that US$ could pullback which supports the stock market to rebound. 3.1.2 PowerShares DB US Dollar Index Bullish Fund (UUP 30 min), a few negative divergences on the intraday chart also support a possible pullback of the US$.
3.4.1 United States Oil Fund, LP (USO Daily), hollow red bar means oil cold rebound which is good for the stock market.


8 Comments