Summary:
Up on light volume is not bearish at least recently.
Bullish Abandon Baby was formed on QQQQ, IWM daily chart.
The bear's only chance is US$ which could be up tomorrow.
| TREND | MOMENTUM | COMMENT - Sample for using the trend table. | ||
| Long-term | Up | |||
| Intermediate | Up | Neutral | ||
| Short-term | Up* | Neutral | ||
| SETUP | DATE | TRADE | STOP LOSS | Mechanic trading signals for reference only. Back tested since 2002. |
| SPX Major Swing | 08/21 | Buy next open | 09/25 Low* | Win: 41%, Gain/Loss Ratio: 2.9, Ann Return/Trade: 55% yr |
| NYMO Sell | 09/23 | Sell next open | 09/25 High | Short-term play. Stopped out on 09/28 with gain. |
INTERMEDIATE-TERM: NO UPDATE
Bottom line, 1.2.1 Dow Theory: Averages Must Confirm, at least I don’t have that imagination to expect SPX to go much higher when BPSPX, NYA200R and NYHILO are all at record highs.
SHORT-TERM: UP,BEAR'S ONLY CHANCE IS THE US$.
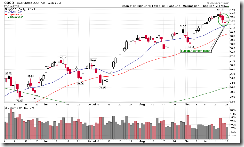
I’ve saw “suspicious” comments about up on light volume already. Well, at least nowadays, who cares about the volume? The green curve below is “SPY percent change to volume percent change ratio” and the cyan bars are marked whenever the green curve was very high, in another word whenever the SPY was up huge on light volume. Looks like in all the cases the SPY was bullish thereafter.
1.1.3 QQQQ Short-term Trading Signals, 1.3.0 Russell 2000 iShares (IWM Daily), Bullish Abandon Baby, up 70% of the time.
All the above plus CPCI and ISEE index mentioned in the After Bell Quick Summary, it does look like bulls are ready for another huge run. Well, the bear still has a hope – that is the US$:
3.1.2 PowerShares DB US Dollar Index Bullish Fund (UUP 30 min), looks like a bullish pattern to me plus 3.3.0 streetTRACKS Gold Trust Shares (GLD Daily), the black bar may mean that UUP has good chances to close up tomorrow.
Overall, I believe short-term is bullish but be aware of US$.
INTERESTING CHARTS: NONE


