Summary:
The primary wave 3 down may have started according Elliott Wave International.
CPCE held above trend line for 3 days, could be a confirmation of an intermediate-term top.
SPX pullback target could be around 875 on the intermediate-term.
Short-term buy on reversal bar model will be triggered if SPX could close in green next Monday.
VIX daily black bar argues for a short-term rebound but the breakout of the weekly Bullish Falling Wedge is "bear" friendly.
| TREND | MOMENTUM | COMMENT - Sample for using the trend table. | ||
| Long-term | Up | |||
| Intermediate | Down | Neutral | ||
| Short-term | Down | Neutral | ||
| SETUP | DATE | INSTRUCTION | STOP LOSS | Mechanic trading signals for reference only. Back tested since 2002. |
| Index ST Model I | Stopped out long with gain on 10/01. No position held now. | |||
| Index ST Model II | 09/29 | Sell next open | 09/29 High | Short position initiated on 09/30. |
| VIX ENV | Watch | Long signal could be triggered soon. | ||
| Reversal Bar | *Watch | *Long if green Monday (Risky) | ||
INTERMEDIATE-TERM: CPCE TOP SIGNAL MAYBE CONFIRMED
1.0.8 SPX Cycle Watch (Weekly), according to Elliott Wave International, the catastrophic primary wave 3 down has started. The arguments are listed below:
- Four of Three is usually where trend reverses. From my chart, yes, SPX has already passed the point, but INDU is right at the position and I hope you still remember my argument for 1.2.0 INDU Leads Market.
- The primary wave 2 lasted 28 weeks which is right a Fib 38.2 of the total 74 weeks of the primary wave 1.
Personally, I cannot see that far, just 2.8.0 SPX:CPCE has been above its trend line for 3 days. This never has happened since the March rebound, so chances are good that the intermediate-term top has confirmed.
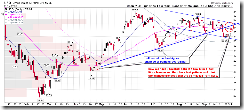
0.0.3 SPX Intermediate-term Trading Signals, if indeed the intermediate-term was topped then the text book target for a broken Bearish Rising Wedge is along the dashed blue line. My guess is 875 area.
0.0.0 Signal Watch and Daily Highlights, take a look at the overview signals. Short-term is a little bit oversold, intermediate-term signals are all “for sale” and most breadth signals are still in overbought area.
SHORT-TERM: BUY ON REVERSAL BAR MODEL WILL BE TRIGGERED IF SPX COULD CLOSE IN GREEN NEXT MONDAY
0.0.2 SPY Short-term Trading Signals, hollow red bar plus oversold (especially the NYMO at the bottom is a very reliable signal) plus Index ST Model I is still not “for sale”, so if we have a green Monday then this is a long setup, target could be $104.
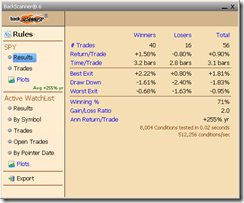
Below is the back test summary for the long setup mentioned above. The 71% winning rate is not bad. Just it’s a little bit risky now as we may well in the trend change transition period.
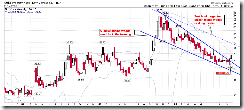
2.0.0 Volatility Index (Daily), solid black bar also support a short-term rebound. However 2.0.1 Volatility Index (Weekly), looks bearish. The Bullish Falling Wedge was broken on the upside so the target could be around 37.
INTERESTING CHARTS:
3.4.1 United States Oil Fund, LP (USO Daily), 2 reversal bars in a row (solid black bar plus hollow red bar) plus it looks a lot like a back test of a broken trend line, so oil could pullback. And on the intermediate-term basis, I’m bearish on the oil too.


