Summary:
Lists conditions for qualifying a decisive breakout tomorrow.
| TREND | MOMENTUM | COMMENT - Sample for using the trend table. | ||
| Long-term | Up | |||
| Intermediate | Down | Neutral | ||
| Short-term | Up | Neutral | ||
| SPY SETUP | ENTRY DATE | INSTRUCTION | STOP LOSS | Mechanic trading signals for reference only. Back tested since 2002. |
| ST Model I | Watch Breakout | Stopped out long with gain on 10/01. No position held now. |
||
| ST Model II | Stopped out short flat on 10/08. No position held now. |
|||
| VIX ENV | 10/06 L | *Adjust stop loss | 10/13 Low | |
| Reversal Bar | 10/05 L | *Adjust stop loss | 10/09 Low | |
| Up 3 days in a row while volume down 3 days in a row | 10/12 S | Hold 3 days |
61% winning rate since 2002. *I covered intraday flat on 10/13. |
INTERMEDIATE-TERM: ST MODEL I BUY SIGNAL IF BREAKOUT ABOVE THE SPX 9/23 HIGH
Nothing new today. 1.2.1 Dow Theory: Averages Must Confirm, the breadth signals are way too overbought plus TRAN has yet confirmed the INDU new high, so I still think there’ll be at least 10% correction ahead.
However, no argue, if SPX breakout above its 9/23 high at 1080, the ST Model I will signal BUY and theoretically it should be blindly followed. Just under the current market conditions (mainly because SPY has too many gaps. It’ll be the 13th gap if the SPY does gap up tomorrow because of the INTC ER .), if you have no confidence in following the signal, then perhaps the conditions below are helpful in gauging if indeed the breakout is decisive:
- Close > Open and Close > 1080.
- At least volume > today's volume.
- Both SPY and QQQQ new high.
- Because of the relatively low volatility (Refer to the chart 0.0.1 Market Top/Bottom Watch, see ATR and BB Width indicators at bottom), so if the ST Model I does give buy signal tomorrow, the stop loss will be very tight, which should be around today’s low, so estimate the risks yourself accordingly.
- Refer to the chart 6.3.1 Major Accumulation Day Watch, if tomorrow happens to be a Major Accumulation Day (NYUPV/NYDNV > 9) then the bullish confidence could be a little bit higher, because it could be considered as a major bottom formed by 2 very close (well, reluctantly) Major Accumulation Days.
SHORT-TERM: MAINTIAN THE CONSOLIDATION THEN PULLBACK FORECAST
Short-term, before I see a decisive breakout tomorrow, will maintain the consolidation then pullback forecast.
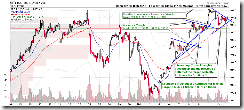
1.0.3 S&P 500 SPDRs (SPY 30 min), this chart is interesting, it’s the 3rd Symmetrical Triangle breakout with the text book target at $108.66. The previous 2 triangles were so far exactly on the target. So does that mean this one will be right on the target too? By the way the bear’s hope is also here, because the 3rd time is the charm... LOL
INTERESTING CHARTS: NONE

