Summary:
Two Major Distribution Days within 5 days usually mean more correction ahead.
VIX breakout, target could be around 37.50.
Could be a Head and Shoulders Bottom formed on the UUP chart.
Market is oversold. Expect a short-term rebound.
| TREND | MOMENTUM | EMOTION | COMMENT - Sample for using the trend table. | |
| Long-term | Up | Disbelieve | ||
| Intermediate | Down | Neutral | ||
| Short-term | Down | *Oversold | ||
| SPY SETUP | ENTRY DATE | INSTRUCTION | STOP LOSS | Mechanic trading signals for reference only. Back tested since 2002. |
| ST Model | *Officially in downtrend. | |||
| Reversal Bar | ||||
| NYMO Sell | 10/21 S | Break even |
Partial profits taken. |
|
| VIX ENV |
*Buy signal not confirmed on 10/29. |
|||
INTERMEDIATE-TERM: COULD BE MORE CORRECTION AHEAD
6.3.2b Major Distribution Day Watch, 2 Major Distribution Days within 5 days usually means more correction ahead, although there could be a short-term bounce first.
2.0.1 Volatility Index (Weekly), a clear breakout, so the target could be around 37.5 which means that the market may correct further.
3.1.2 PowerShares DB US Dollar Index Bullish Fund (UUP 30 min), could be a Head and Shoulders Bottom in the forming.
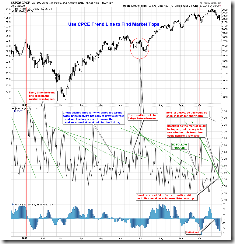
2.8.0 SPX:CPCE, looks to me the trend line still held, this means that the top signal is still valid. Bull’s hope is the dashed trend line, if broken, then at least the top signal is ambiguous because it’s hard to say which trend line (thick one or dashed one) is the correct trend line.
SHORT-TERM: EXPECT A REBOUND
0.0.2 SPY Short-term Trading Signals, the NYADV and NYMO oversold usually work good, so although the Stick Sandwich pattern argues for more correction in a little bit longer term, very short-term a rebound last at least a day or two is very likely.
1.1.4 Nasdaq 100 Index Intermediate-term Trading Signals, NADNV too high.
1.0.2 S&P 500 SPDRs (SPY 60 min), my guess is the market may repeat the last case when ChiOsc was this low: Monday pullback a little at first then rebound. 6.3.2a Major Distribution Day Watch, statistically, Monday has 67% chances of closing in green.
INTERESTING CHARTS:
I’ve updated all the setups in the trend table. If interested, take a look at Introducing Mechanical Trading Model. In trend table, I marked the ST Model as officially in a down trend. Just the test found the winning rate is not good if short as soon as the model switches into down trend. So right now no short signal yet.


