Summary:
Fib 50 retracement, multiple resistances ahead, bulls are not out of the woods yet.
| TREND | MOMENTUM | EMOTION | COMMENT - Sample for using the trend table. | |
| Long-term | Up | Disbelieve | ||
| Intermediate | Down | Neutral | ||
| Short-term | Up | Neutral | Doubt | |
| SPY SETUP | ENTRY DATE | INSTRUCTION | STOP LOSS | Mechanic trading signals for reference only. Back tested since 2002. |
| ST Model | Officially in downtrend. | |||
| Reversal Bar | ||||
| NYMO Sell | 10/21 S | 11/04 High |
*Stopped out with gains on 11/05 |
|
| VIX ENV | ||||
INTERMEDIATE-TERM: STILL COULD BE A SELLABLE BOUNCE
The bottom line, short-term is up, not sure about the intermediate-term now. For 3 reasons listed below, bulls are not out of the woods yet:
1. Up on light volume. The chart below highlights bars when SPX was up 4 days in a row while volume was down 4 days in a row. Other dates not displayed on the chart are: 08/02/2004, 01/09/2006, 05/07/2007, 09/14/2007. All dropped the next day. Of course, the cases are too few to count seriously, so treat them as fun stuff.
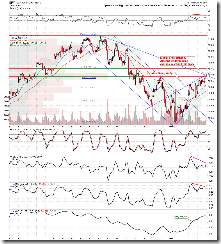
2. 1.0.3 S&P 500 SPDRs (SPY 30 min), rebounded right to the Fib 50, so still within a normal rebound range. Plus there’re multiple resistances ahead as well as lots of negative divergences, so it’s hard to say tomorrow.
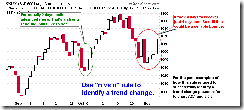
3. 7.1.0 Use n vs n Rule to Identify a Trend Change, it took 4 days to recover the previous 1 day loss therefore by definition it still is a sellable bounce.
SHORT-TERM: NO UPDATE
INTERESTING CHARTS: NONE


