Summary:
Not willing to bet either up or down at the current stage.
Expect a short-term pullback soon.
| TREND | MOMENTUM | EMOTION | COMMENT - Sample for using the trend table. | |
| Long-term | Up | Disbelieve | ||
| Intermediate | Down | Neutral | ||
| Short-term | Up | Neutral | ||
| SPY SETUP | ENTRY DATE | INSTRUCTION | STOP LOSS | Mechanic trading signals for reference only. Back tested since 2002. |
| ST Model | Officially in downtrend. | |||
| Reversal Bar | ||||
| NYMO Sell |
Stopped out with gains on 11/05. |
|||
| VIX ENV | ||||
INTERMEDIATE-TERM: IT'S NOT A BROAD BASED RALLY
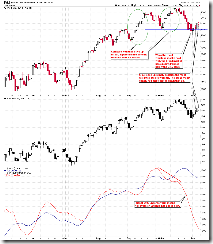
From the equal weighted index below, see green cycles, the rebound was much weaker than those of Sep and Oct, although from the weighted index such as SPX, it’s not easy to see the differences. This could mean that the recent rally was mainly because of a few heavy weighted stocks (therefore more likely a distribution pattern). Also the Russell 2000 underperform means the same thing. So I’m more willing to believe what we’re having now is just a rebound, the correction is not over yet.
So, if you missed the 5 days' rally then don’t chase high here. On the other hand, if you really want to short, take a look at the AAII Sentiment Survey first which shows that retailers are mostly bearish and think really hard about since when most retailers are so lucky for being at the right side for the market.
SHORT-TERM: PRICE UP VOLUME DOWN PATTERN USUALLY MEANS A PULLBACK
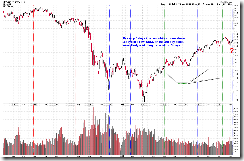
On the Friday close, SPX was up 5 days in a row while volume was down 5 days in a row forming a bearish pattern. Since 2002, there’re only 4 similar cases (Up 5 days while volume down 4 days): 11/28/2008, 5/7/2007, 1/9/2006, 8/2/2004, all pulled back the next day and all had at least one big down day thereafter. Also a back test summary since 2002 below: SPY up 5 days in a row, volume down 2 days in a row, sell at close then cover 4 days later at close.
6.4.4 SPY Price Volume Negative Divergence Watch, similar setup, take a look.
INTERESTING CHARTS:
As mentioned above, according to the AAII Sentiment Survey, most retailers are bearish. To be fair, let me show you a “bear friendly” survey as well. The "granddaddy", Investor's Intelligence Sentiment Survey is very close to an extremely bullishness.
Also according to the Commitments of Traders report, looks like institutions are selling while retailers are buying. Look at the red rectangle, see how retailers kept buying on the last year’s sharp sell off while sold too soon once indeed the rally came. Look at the green rectangle, how there was a sudden buying surge from the institutions when the market pulled back sharply in July. I’m very impressed.
So again, the bottom line, mixed signals, let’s wait and see.


