Finally, I see a potential top pattern is in the forming which is big enough, IF BREAKDOWN, to sustain a few days pullback.
But again there’s always a but – a bullish continuation pattern could be in the forming too (see the chart above). Personally, I’m inclined to believe the bearish scenario, because of the 2 reasons below:
A powerful double cycle turn date which now looks a lot like a top.
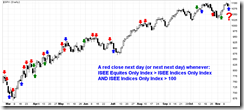
A too bullish ISEE Indices & ETFs Only Index readings, which has led to a red close within the next 2 days (most likely the next day, see red arrows), 21 out of 27 times (78%) since the March rally.
Oh, one more thing, has anyone noticed this? If this is a bear trap, then certainly it’s not apparent enough for most bears to take the bait. So perhaps the trap is designed to trap the smartest bears? (Forgive my English, I hope you understand my tone) Enjoy your weekend!


