Summary:
Bears have all the cycle turn date supporting them but the bulls' weapon of mass destruction is the dollar - not sure if it will have a devastating drop next week.
| TREND | MOMENTUM | EMOTION | COMMENT - Sample for using the trend table. | |
| Long-term | Up | Disbelieve | ||
| Intermediate | Down | Neutral | ||
| Short-term | Up | Neutral | ||
| SPY SETUP | ENTRY DATE | INSTRUCTION | STOP LOSS | Mechanic trading signals for reference only. Back tested since 2002. |
| ST Model | 11/11 S | *Adjust Stop Loss | *Breakeven |
|
| Reversal Bar | 11/11 S | *Adjust Stop Loss | *Breakeven | |
| NYMO Sell |
*Entry not confirmed. Abort, abort! 🙂 |
|||
| VIX ENV | ||||
| Patterns ect. |
INTERMEDIATE-TERM: THE NEXT WEEK COULD BE A TURNING WEEK UNLESS DOLLAR DROPS SHARPLY
From all the cycles due on Friday and the next week, it looks high likely the market will turn lower starting from the next week. However, bulls own a weapon of mass destruction – the dollar. I’m not sure if the dollar will drop sharply the next week. And if that’s true then the market will keep rising while all the cycle due date will look like a bottom date.
Let’s take a look at the weapon of mass destruction first.
3.1.2 PowerShares DB US Dollar Index Bullish Fund (UUP 30 min), could be a Head and Shoulders Top in the forming with target around $21.60. From the chart 3.1.1 PowerShares DB US Dollar Index Bullish Fund (UUP Weekly), $21.60 means the breakdown of the last important support area.
Also from US$ Index chart, the text book target for the Double Top is 65.76, which is still at galaxy far far away.
So to summarize, there’s a chance that dollar will drop sharply and therefore the SPX will go much much higher. To be fair, I also posted a bullish dollar chart below for your reference.
Personally, I have no idea about where dollar will go, it may depend on what happens in Beijing when Obama visits China.
From trading point of view, if you followed my setup, because of the “safety first” rule, we should now set the stop loss to breakeven. However, because another reversal bar was formed on the SPY chart on Friday (see red arrow), therefore if Open > Close the next Monday, we’ll have another short signal. So accordingly, if the next Monday, the market rises, you could either wait until close to decide if the stop loss is needed or could let the breakeven stop work first then wait until the close to buy back if it turns out to be the open > close at the end.
OK, now let’s take a look at all the bears conventional weapons. As we all know that the conventional weapons are no compare of the weapons of mass destruction, no matter how advanced they are, so again, the dollar is the key.
The main problem has already mentioned in the Friday’s After Bell Quick Summary, 1.0.4 S&P 500 SPDRs (SPY 15 min), for 4 days in a row, the market popped high then sold off hard. This looks a lot like a distribution pattern.
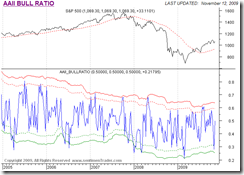
Look at the retailers’ sentiment – AAII Bull Ratio. Remember the last weekend report? Retailers were mostly bearish and therefore we got a huge up Monday. And now, retailers are becoming bullish. Could be more bullish though.
Now, let’s take a look at the retailers’ trading actions – Rydex Bull/Bear RSI spread (The ratio between buying Rydex bullish fund and bearish fund), the readings are too bullish.
And now compare institutions and retailers COT report. Apparently institutions are bearish while retailers are bullish.
OK, the cycle:
0.0.3 SPX Intermediate-term Trading Signals, the next 10 day cycle could be a down cycle. Besides there’re too many too large negative divergences on the chart so even without the possible 10 day down cycle, the chart looks very bearish.
1.0.9 SPX Cycle Watch (60 min), I’ve mentioned this before, double cycle turn date could be very powerful.
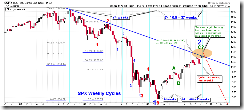
1.0.8 SPX Cycle Watch (Weekly), I’ve mentioned this too, the next week could be a turning week. Also some fib calculations are anticipating a turning week the next week too. A chart from Elliott Wave International also shows the same idea with more precise turning date.
As I said before, I don’t believe similarity but the chart about the weekly gap looks interesting, worth of watching as weekly gap is very rare.
The last but not the least, don’t forget what the QQQQ black bar usually says: a short-term top is not far away. 1.1.3 QQQQ Short-term Trading Signals, so far worked OK. So how about this time?
SHORT-TERM: NO UPDATE
INTERESTING CHARTS: NONE


