Summary:
Expect more pullbacks ahead. Could see a very short-term rebound though.
| TREND | MOMENTUM | EMOTION | COMMENT - Sample for using the trend table. | |
| Long-term | Up | Disbelieve | ||
| Intermediate | Down | Neutral | ||
| Short-term | Down | Neutral | ||
| SPY SETUP | ENTRY DATE | INSTRUCTION | STOP LOSS | Mechanic trading signals for reference only. Back tested since 2002. |
| ST Model | 11/17 L | 11/19 Low |
*Stopped out of long position with loss. I mentioned in 11/16 report, I had no confidence in this trade.
|
|
| Reversal Bar | *Long if green Monday |
*No confidence in this trade too. If Monday eventually Open > Close then better follow the NYMO Sell Setup below.
|
||
| NYMO Sell | *Short if Open > Close Monday |
*Setup not confirmed on Friday, waiting for Monday. |
||
| VIX ENV | ||||
| Patterns ect. |
INTERMEDIATE-TERM: EXPECT MORE PULLBACKS
I was not sure about the market’s direction in the Friday’s After Bell Quick Summary, until I saw the Rydex Bull/Bear RSI Spread (Retailers buying Rydex bullish fund to bearish fund ratio) last night, now I believe more pullbacks ahead. See chart below. The green, blue and red lines represent the retailer’s trilogy: chasing high, buying dip and selling low. Unfortunately, the timing was pretty bad except the very first chasing high which had a little bit profit room. Now, retailers are in happy buying dips stage (blue line), missing the final selling low red line, so accordingly, I believe the pullback is not over yet. And I’m even not sure if we’ll see a green Monday anymore.
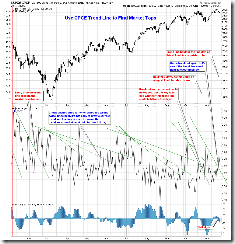
2.8.0 SPX:CPCE, trend line held confirming this at least is a short-term top.
Now, let’s review the bigger picture:
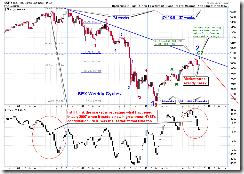
1.0.8 SPX Cycle Watch (Weekly), Fib 50 price target and Fib 50 time target plus weekly cycle due plus NYSI none confirmation, all pointing to a possible big top. Well, I know this could be another the wolf coming AGAIN. Well, we all know that the wolf coming story is meant to teach our kids no to lie but the story also implies that eventually the wolf does come, doesn’t it?
Still remember the Climax Buying indicator? We had yet another buying climax spike this week. It' doesn’t mean an absolute top but at least more choppy market actions should be expected.
COT report, still retailers are buying while institutions are selling.
So considering all above, I still believe, AT LEAST (if you don’t believe the wolf is coming this time), the 2007 July kind of top is replaying.
SHORT-TERM: COULD REBOUND ON MONDAY
For all the reasons listed below, I believe we’ll see a Monday rebound. After seeing the Rydex Bull/Bear RSI Spread chart mentioned above, I’m not sure if the market could eventually close in green though.
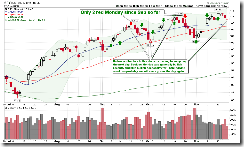
0.0.2 SPY Short-term Trading Signals, see green arrows, Monday was very bullish recently. Besides, the hollow red bar seemed to mean a rebound at least the next day.
1.0.4 S&P 500 SPDRs (SPY 15 min), ever since the March there were no cases that SPY gapped lower for 4 days in a row and it’d be the 5th consecutive gap down open if the SPY opens lower again on Monday. Also since the March, the bear’s attacks were all ended with the 3rd gap down, therefore what the chances are that, if Monday does gap down, the 3rd consecutive down gap remains unfilled for quite a long time? By the way, about the gap down and the 3rd consecutive unfilled down gap, from another angle, we can say, if indeed these happened, then perhaps chances are good that indeed the wolf is coming this time.
3.1.0 PowerShares DB US Dollar Index Bullish Fund (UUP Daily), black bar could mean a reversal. The dollar pullback is good for the stock market.
3.4.1 United States Oil Fund, LP (USO Daily), hollow red bar also means a reversal therefore oil could rebound which is good for the stock market too.
INTERESTING CHARTS:
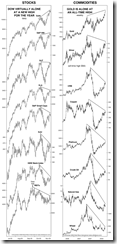
The chart below is from Elliott Wave International, not a good sign, I think.


