Summary:
No update, no need waste time to read further if don't like to hear lecture which provides small samples about why I always say be careful.
| TREND | MOMENTUM | EMOTION | COMMENT - Sample for using the trend table. | |
| Long-term | Up | Disbelieve | ||
| Intermediate | Down | Neutral | ||
| Short-term | Down | Neutral | ||
| SPY SETUP | ENTRY DATE | INSTRUCTION | STOP LOSS | Mechanic trading signals for reference only. Back tested since 2002. |
| ST Model | 11/23 L | 1.5xATR(10) |
For SPY the stop loss is around 2%. Use 4% for 2xETF and 6% for 3xETF. No confidence in this trade.
|
|
| Reversal Bar | 11/23 L | 0.9xATR(10) |
For SPY the stop loss is around 2%. Use 4% for 2xETF and 6% for 3xETF.
No confidence in this trade.
|
|
| NYMO Sell | 11/24 S | *Short intraday | *0.8xATR(10) |
For SPY the stop loss is around 2%. Use 4% for 2xETF and 6% for 3xETF. |
| VIX ENV | ||||
| Patterns ect. |
INTERMEDIATE-TERM: MAINTAIN THE VIEW FOR BIGGER AND BIGGER UP AND DOWN SWINGS AHEAD
Nothing new to say today. The rest one and half trading day should more likely to rise than fall. We may have to wait until the next week to see the real market direction. So without further info, I temporarily maintain the view that we’re now repeating the 2007 July top that we'll see bigger and bigger up and down swing ahead and therefore be careful chasing high here.
1.0.3 S&P 500 SPDRs (SPY 30 min), the most bullish case: could be an Ascending Triangle in the forming, target is around 114ish.
I’ll give a little lecture below so if not interested, no bother to read.
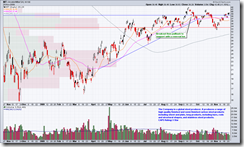
I see some bulls in my forum (not in this blog) like to mock bears without any reasons whenever the market rose huge. So I’d like to show you the SPY chart since the August. Apparently it’s not as bullish as it feels. The market had bigger and bigger swings since the August, the best gain is 10% while the worst could only be 4%. Now the problem is no one could guarantee that there won’t be another 5% pullback. And if we do get a 5% pullback, will you hold your position? Isn’t completely impossible for another 5% thereafter? Well, I know you’ll say you simply sell high then buy dip to avoid this. If you really think this way then I don’t see reasons why people seeing glass “half empty” should be laughed by people seeing glass “half full”.
The individual stocks listed below were deliberately picked in Sep (believe or not, they were chosen for today’s post). Someone in my forum could prove that indeed they were picked in Sep. The links for those chart in my public list is Here – the last 2 pages. I just want to show you how important to take profit and set proper stop loss (suppose the position was entered on the day pointed by the annotation box). Otherwise simply buy and hold until now, lots of these picks would be underwater. The question is: what should I do for those underwater stocks? Continue to hold them? Well, we’ll see. Again, I just want to say, no matter you see glass half full or half empty, trade properly, there’s no point to laugh people who sees a half glass of water in another way, after all you could not 100% guarantee that the best part of the market have not already gone.
SHORT-TERM: NO UPDATE
INTERESTING CHARTS: NONE


