Summary:
Follow through is needed to confirm the today's breakout.
Very bullish seasonality until new year, but be careful because it seems that everybody are so sure about this easy money.
Still a short-term top could be very close.
| TREND | MOMENTUM | EMOTION | COMMENT - Sample for using the trend table. | |
| Long-term | Up | Disbelieve | ||
| Intermediate | Down | Neutral | ||
| Short-term | Up | Neutral | ||
| SPY SETUP | ENTRY DATE | INSTRUCTION | STOP LOSS | Mechanic trading signals for reference only. Back tested since 2002. |
| ST Model | 12/10 L |
*Adjust stop loss |
*Breakeven | |
| Reversal Bar | 12/10 L |
*Adjust stop loss |
*Breakeven |
|
| NYMO Sell |
Stopped out short position flat. |
|||
| VIX ENV | ||||
INTERMEDIATE-TERM: FOLLOW-THROUGH WANTED
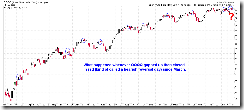
As mentioned in the After Bell Quick Summary, today is the first time that SPX closed above its month long trading range. The close only chart below shows clear breakout but the candlestick chart is not so convincing, so a follow-through is wanted tomorrow.
7.1.1 Primary and Secondary Indices Divergence Watch, secondary indices were greatly improved, TRAN breakout in convincing manner while a bullish 1-2-3 formation is confirmed on Russell 2000.
2.4.4 NYSE McClellan Oscillator, breadth is improved too. See green lines on the right, NYMO higher high and NYHGH higher high as well before the NYA higher high forming a positive divergence.
So all in all the bull’s posture is improved plus the good news is that since today until the new year, the seasonality is very very bullish.
- The Most Wonderful Tiiiiime Of The Yearrrrrrr from Quantifiable Edges.
- The December options expiration week has been positive 24 out of 27 years since the inception of S&P 500 futures, according to www.sentimentrader.com.
- Santa Claus Rally: Normally occurs during the last five trading days of the year and the first two in January.
- January Effect: Refers to the tendency for small cap stocks to outperform large cap stocks during January. However, that most of the January Effect now takes place during the last half of December and sometimes even starts during November. This also can be seen on chart 7.1.1 above, Russell 2000 and TRAN (mainly because of airlines) outperform should be related to the January Effect.
So to summarize, it looks like the following very bullish 4 weeks (include the first week of the new year) are almost sure thing, doesn’t it? I’m not a fan of conspiracy so I don’t want to lecture about “sure thing is actually not sure blah blah blah”. But it’s always not wrong to be prudent about this sure thing easy money. Take a look at the Option Speculation Index chart below, extremely bullish, so apparently you’re not the only one who wants this sure thing easy money, aren’t you?
SHORT-TERM: STILL A TOP COULD BE VERY CLOSE
The today’s rally wasn’t totally unexpected, as mentioned in the Friday’s After Bell Quick Summary there’s possibility that the previous high could be tested, so the rally didn’t change my view for calling a short-term pullback. The main reason is the Bearish Reversal Bar on QQQQ daily chart. See below, a Bearish Reversal Bar didn’t necessarily mean an immediate pullback, in some cases, it could delay for a few days.
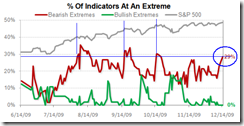
The rally today also made lost of indicators in www.sentimentrader.com reach bullish extreme. The chart below shows whenever there’re more than 30% bullish extremes, the SPX went nowhere thereafter. So this is another reason that I still think a pullback is possible.
INTERESTING CHARTS:
3.4.1 United States Oil Fund, LP (USO Daily), filled black bar plus ChiOsc too low, still oil could rebound soon.


