Summary:
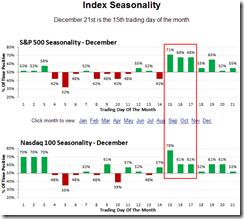
Despite very bullish seasonality, the market may not be able to go up much because there're too few bears.
A little bit bearish biased toward Monday.
| TREND | MOMENTUM | EMOTION | COMMENT - Sample for using the trend table. | |
| Long-term | Up | Disbelieve | ||
| Intermediate | Down | Neutral | ||
| Short-term | Down | Neutral | ||
| SPY SETUP | ENTRY DATE | INSTRUCTION | STOP LOSS | Mechanic trading signals for reference only. Back tested since 2002. |
| ST Model |
*Long if up Monday |
|||
| Reversal Bar |
*Long if up Monday |
|
||
| NYMO Sell |
|
|||
| VIX ENV | ||||
INTERMEDIATE-TERM: BULLISH SEASONALITY BUT MARKET MAY NOT UP HUGE
Nothing new, seasonality wise, the next 3 weeks are verli verli buuullliiish, for details, please see 12/14/2009 Market Recap, especially the first 3 days next week.
Sentiment wise, Investor's Intelligence Sentiment Survey and AAII both show verli verli buuullliiish sentiment. For details please see 12/16/2009 Market Recap and 12/17/2009 Market Recap. Therefore, no doubt the Options Speculation Index made a new high again.
The conclusion, I don’t have any reason to suspect this kind of bullishness, but it seems that the bull wagon is a little bit crowded therefore I suspect how high the market could go.
Two warnings, I’m not saying the market will drop, just some info I want you to know as I promised.
Still remember the Climax Buying indicator? We had yet another buying climax spike this week. Be careful of a cluster of buying climaxes, could be a distribution pattern.
NET Institutional Buying and Selling from www.stocktiming.com, only Thursday’s data is available but the distribution bar seems a little large. This also proves the above mentioned distribution pattern.
4.0.2 NYSE Advance-Decline Issues, 4.0.3 Primary and Secondary Indices Divergence Watch, 4.0.7 Collection of Leading Indicators I, take a look at all these charts if you have time, the bullish gesture keeps improving, although still some warnings left, but there’re always warnings no matter what, so basically I don’t see any solid top signs. The reason I still put “intermediate-term down” in the trend table is because the MACD in 0.0.3 SPX Intermediate-term Trading Signals still is sell and 0.0.8 SPX:CPCE is sell too. All in all, intermediate-term mixed signals, I’m in wait and see mode.
SHORT-TERM: A LITTLE BIT BEARISH BIASED TOWARD MONDAY
I think everyone knows that Monday will be very bullish (see 12/18/2009 After Bell Quick Summary), just maybe it’s not as bullish as everyone expects.
1.0.4 S&P 500 SPDRs (SPY 15 min), could be a Head and Shoulders Bottom in the forming, good, but ChiOsc is a little bit too high so it could pullback in Monday morning to form a 2nd right shoulder.
3.4.1 United States Oil Fund, LP (USO Daily), black bar, so oil could pullback which is not good for the stock market.
6.4.9 All Up Day Watch, strict speaking, Friday is not an All Up Day, because AGG had a zero changes. Just from the chart, see dashed blue lines, even it’s a pseudo All Up Day, the next day all dropped, not big though.
INTERESTING CHARTS:
Rydex Bull/Bear RSI Spread (the differences between Rydex bullish fund inflow and bearish fund inflow), another dramatic changes. From all those dramatic changes recently, I begin to doubt this chart’s reliability. See Rydex Bullish Fund inflow and Bearish Fund inflow charts below, they didn’t change much, how come Rydex Bull/Bear RSI Spread fluctuated so much? So maybe we should forget about this chart for now.


