SIGNAL MOMENTUM COMMENTClick links to see chart or visit my public chart list.
Long-term Up    
Intermediate Up Neutral

3.0.0 TNX: Top in a month?
8.1.0 Normalized NYTV: Topped?
12/31 Recap:
II and AAII survey both show extremely low # of bears.
4.0.4 Dow Theory: Multiple resistances and breadth very overbought.

Short-term *Down Neutral

1.0.2 SPY: 15 unfilled gaps. 
0.0.3 SPX: CPC and CPCE MA10 are too low. 
0.0.9 Put Call Ratio: Too extreme, top could be very close.

CONCLUSION Signals presented in the short-term comment area are enough to justify a short selling.
Shorted on 01/11. Close position at your own will.
SPY SETUP ENTRY DATE INSTRUCTION STOP LOSS Mechanic trading signals, details are HERE
Take profit whenever you see appropriate.
ST Model 12/21 L 12/31 Low For chart, please see 0.0.4 SPY Mechanical Trading Model
Reversal Bar    

NYMO Sell  


VIX ENV        
WATCH LIST COMMENT – *New update, they may not be mentioned in the report. Click links to see more details.
IWM & QQQQ 4.1.2 Russell 2000 iShares (IWM Weekly) : Breakout but STO is too high may pullback soon.
1.3.0 Russell 2000 iShares (IWM Daily): Bearish reversal bar doesn’t look good. 
EMERGING 1.4.0 Shanghai Stock Exchange Composite Index (Daily): *Two green bar means more upside ahead.
1.4.2 iShares MSCI Emerging Markets (EEM 30 min): *Double Top, target 41.77.
FINANCIALS 3.5.1 Financials Select Sector SPDR (XLF 30 min): *Double Top, target 14.80.
REITS 3.6.1 Real Estate iShares (IYR 30 min): *Double Top, target 44.66.
OIL & ENERGY
GOLD
DOLLAR
BOND 4.2.0 20 Year Treasury Bond Fund iShares (TLT Weekly): STO too low.
3.0.1 20 Year Treasury Bond Fund iShares (TLT Daily): Hammer plus channel support.
Bond could rebound, but overall it’s in a downtrend.

INTERMEDIATE-TERM: EXPECT HEADWIND AHEAD

No update, watch 4.1.0 S&P 500 Large Cap Index (Weekly) for overhead target/resistance and 4.0.4 Dow Theory: Averages Must Confirm for overbought breadth signals.

SHORT-TERM: MAY REBOUND BUT COULD BE MORE PULLBACKS AFTERWARDS

Take a look at today’s After Bell Quick Summary first please: I have no idea if the pullback is over or not, but for sure sooner or later, there’ll be a -1,000 TICK readings, this means at least there’ll be a moment of panic sellings ahead.

TickWatch

If you paid attention to the trend table comment area, you might have noticed that lots of short-term bearish signs were fixed, but still the put call ratio is at very extreme level so even if the market rebound to a new high, it eventually will pullback, therefore I think from now on it’s better to reduce long positions whenever the market rallies.

0.0.9 Extreme Put Call Ratio Watch.

PutCallRatioWatch

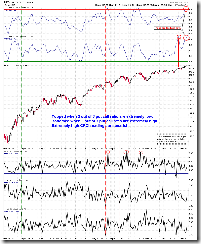
0.0.3 SPX Intermediate-term Trading Signals.

SPXMidTerm

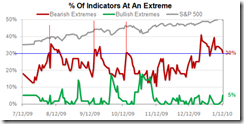
www.sentimentrader.com % of Indicators at bearish extremes are still high, maybe not very extreme but if there’s a huge rebound tomorrow then most likely tomorrow night I’ll again bring out this chart to scare (in vain) the fearless bulls. LOL

IndicatorsAtExtremes 

INTERESTING CHARTS: NONE