TREND INDICATOR MOMENTUM INDICATOR COMMENT (Click link to see chart) Long-term 3 of 3 are BUY Intermediate 3 of 3 are SELL 4 of 6 are NEUTRAL SPY ST Model is in SELL mode Short-term 1 of 1 are SELL 5 of 8 are NEUTRAL
BULLISH 2.4.4 NYSE McClellan Oscillator: *Oversold.
0.0.6 Nasdaq 100 Index Intermediate-term Trading Signals: *NADNV too high.BEARISH 2.3.4 Nasdaq Total Volume/NYSE Total Volume: *Topped again? CONCLUSION
SPY SETUP ENTRY DATE STOP LOSS INSTRUCTION: Mechanic signals, back test is HERE, signals are HERE.
TRADING VEHICLE: SSO/SDS, UPRO/SPXUST Model 01/27 S 1.9 x ATR(10) Reversal Bar NYMO Sell 01/21 S *01/26 High *Adjust Stop Loss VIX MA ENV
OTHER ETFs COMMENT – *New update, they may not be mentioned in the report. Click links to see more details. IWM & QQQQ 8.2.9a QQQQ – 2009 - 8.2.9h QQQQ – 2002: Seasonality is bearish until the end of January.
0.0.5 QQQQ Short-term Trading Signals: *Breakdown from consolidation area, more downside ahead.EMERGING 1.4.0 Shanghai Stock Exchange Composite Index (Daily): Double Top or Bearish 1-2-3 Formation? CANADA TSX 1.5.0 iShares CDN S&P/TSX 60 Index Fund (XIU.TO Daily): Double Top, target $15.77. *TOADV oversold.
1.5.2 TSE McClellan Oscillator: *Oversold.
I believe TSX will rebound soon. For intermediate-term, however, the Double Top is still in play.FINANCIALS REITS MATERIALS 3.4.4 Materials Select Sector SPDR (XLB Daily): ChiOsc is very oversold now. OIL & ENERGY 3.4.0 United States Oil Fund, LP (USO Daily): *Black bar, could lead to a rebound. GOLD 3.3.0 streetTRACKS Gold Trust Shares (GLD Daily): On multiple support, could rebound soon. DOLLAR 3.1.0 US Dollar Index Bullish Fund (UUP Daily): *Confirmed Head and Shoulders Bottom breakout! BOND 3.0.0 10Y T-Bill Yield: Could be a Bull Flag. So yield could rise while bond should fall.
INTERMEDIATE-TERM: THE CORRECTION TARGET FOR INDU COULD BE AROUND 9727
No update. According to chart 4.0.4 Dow Theory: Averages Must Confirm, the correction target could be around 9727.
SHORT-TERM: COULD BE MORE CORRECTION AHEAD
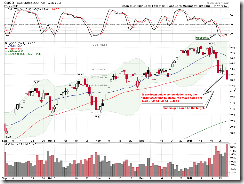
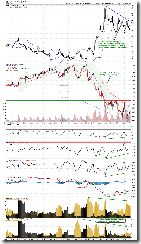
The SPY and QQQQ daily chart pattern don’t look good today, plus Nasdaq Total Volume to NYSE Total Volume ratio spiked again which means we’re still pretty much near a top, therefore could more corrections ahead.
0.0.2 SPY Short-term Trading Signals.
0.0.5 QQQQ Short-term Trading Signals.
2.3.4 Nasdaq Total Volume/NYSE Total Volume.
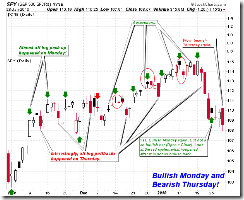
Tomorrow, I’m not sure, could be an up day. Besides the 6.1.1a Extreme CPC Readings Watch mentioned in today’s After Bell Quick Summary, because CPC <= 0.81, there’re 78% chances a green close tomorrow, and the 1.0.9 SPX Cycle Watch (60 min) cycle bottom effect, if it hasn’t expired, the most important is 1.0.3 S&P 500 SPDRs (SPY 30 min), VIX didn’t confirm the SPY new low plus lots of positive divergences, so there’s a chance we could see an up day tomorrow.
If however the market is down again, perhaps bears should take some profits. Three reasons:
The next trading day after tomorrow is the 1st trading day of the February, INDU closed in green 8 out of 10 times since year 2000.
The next trading day after tomorrow is now known as very very bullish Monday. There’s no evidence so far proves that the pattern doesn’t work anymore.
Also don’t forget, according to 1.0.8 SPX Cycle Watch (Moon Phases), new low tomorrow could be a bottom as says the coming Full Moon.
INTERESTING CHARTS: NONE


