|
||||||||||||||||||||||||||||||||||||||||||
|
||||||||||||||||||||||||||||||||||||||||||
|
||||||||||||||||||||||||||||||||||||||||||
|
INTERMEDIATE-TERM: VERY CLOSE TO A TURNING POINT, NOT SURE IT’S A TOP OR BOTTOM THOUGH
See 03/01 Market Recap, there’re several cycles due this week or early next week, among them the 03/08 could be the most important one. The market rises into 03/08 then 03/08 could be a top while the market drops into 03/08 then 03/08 could be a bottom.
SHORT-TERM: A TYPICAL NFP DAY USUALLY REVERSES WHATEVER HAPPENS IN THE MORNING
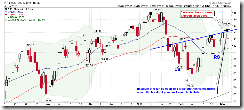
Nothing to say today. 0.0.2 SPY Short-term Trading Signals shows 3 reversal bars in a row, it doesn’t look good. However it also can be seen as a consolidation above the neckline of the Head and Shoulders Bottom after a breakout, which is actually bullish, so very difficult to say now. Personally, I still think that the top signal given by the chart 2.3.4 Nasdaq Total Volume/NYSE Total Volume is very reliable therefore should not be ignored.
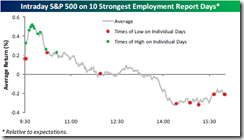
Tomorrow is Non Farm Payroll day, the general rule is to fade the open gap, most likely the later day will reverse whatever happens in the morning. The charts below are from Bespoke, basically saying the same thing. Also statistically, up big tomorrow then the next week will pullback while down big the next week will rebound, and also if up day again tomorrow then this week is an all up weekday week then the next week will most likely consolidate, the chances of up big is low.
STOCK SCREENER: For fun only, I may not actually trade the screeners. Since SPY ST Model is in BUY mode, only LONG candidates are listed. For back test details as well as how to confirm the entry and set stop loss please read HERE. Please make sure you understand the basic risk management HERE.
Since the intermediate-term direction is not clear, so no stock screeners from now on until the dust settles.


