|
||||||||||||||||||||||||||||
|
||||||||||||||||||||||||||||
|
||||||||||||||||||||||||||||
|
INTERMEDIATE-TERM: RISE TO 03/08 THEN PULLBACK TO 03/16?
Maintain the forecast for a rebound (now looks like there’ll be a new high) then a bigger correction thereafter. The reason is still the II Survey, too many people were expecting a correction. See red vertical line. There’s only one exception (see thick red vertical line), the rally simply kept going without any meaningful correction.
Personally, I think chances are low for yet another exception of the II correction pattern mentioned above, the reason is that so far the rally is the weakest one since the March last year. The 19 days rally couldn’t recover the previous 13 days loses, and the most of all the volume was flat, comparing with the July last year, the differences are very obvious. So the conclusion is the up momentum is weakening, the next correction should be bigger than the current one.
I’ve been mentioning cycles for quite a time, see Still Think Around March 6 is Important and 1.0.7 SPX Cycle Watch (Daily). The next week, we’ll know if those cycles are worth of paying attention or not. Basically, now it looks like a cycle top and technically the market is overbought so there’re good chances that those cycles may work this time.
Besides, statistically, up big on non farm payroll day (such as the Friday), the market usually pullback the next week. This also conforms with the chart 6.4.6 Weekday Seasonality Watch which was mentioned in the Friday’s After Bell Quick Summary already, see blue rectangles, if all weekdays were up then the next week was unlikely to up big.
The table below lists all the Gann days calculated via Gann Emblem tool. Looks like 03/08, 03/16 and 04/11 are repeated many times, so they could be very important turning points. The logical assumption now is the market will pullback from around 03/08 to around 03/16. 03/15, by the way, according to 1.0.8 SPX Cycle Watch (Moon Phases) is New Moon, and 03/16 is the FOMC day.
SHORT-TERM: OVERBOUGHT
0.0.0 Signal Watch and Daily Highlights, all short-term momentum indicators are now overbought, so there could be a short-term pullback.
Listed below are 2 of my favorite overbought signals, both are very reliable.
2.4.4 NYSE McClellan Oscillator.
T2122 – 4wk New High/Low Ratio.
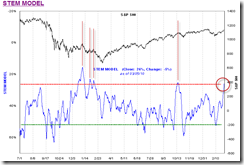
The STEM model from Sentimentrader is interesting, seems seldom overbought but now it is.
STOCK SCREENER: For fun only, I may not actually trade the screeners. Since SPY ST Model is in BUY mode, only LONG candidates are listed. For back test details as well as how to confirm the entry and set stop loss please read HERE. Please make sure you understand the basic risk management HERE.
Since the intermediate-term direction is not clear, so no stock screeners from now on until the dust settles.


