|
||||||||||||||||||||||||||||
|
||||||||||||||||||||||||||||
|
||||||||||||||||||||||||||||
|
INTERMEDIATE-TERM: RISE TO 03/08 THEN PULLBACK TO 03/16?
See 03/05 Market Recap as multiple Gann days are due around 03/08 and 03/16 and the market is pretty overbought so the logic guess is it could pullback from around 03/08 to around 03/16. Now it seems that the guess was wrong, I'll give it one more day, will reevaluate at tomorrow night.
Overall according to the past II pattern, I believe eventually we’ll see a bigger correction. Just for now except for the Gann theory arguing that 03/08 could be a major top, I have no other evidences supporting an imminent big correction.
SHORT-TERM: MORE TOPPING SIGNS
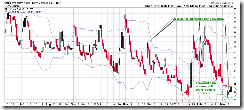
Still expect a pullback. One more topping sign today: 0.0.9 Extreme Put Call Ratio Watch, the CPCE MA(5) above is too low now.
In today’s After Bell Quick Summary, I said since CPC <= 0.81 so we’ll likely see an up day tomorrow, but the final CPC value was adjusted to 0.82, so now I have no idea tomorrow. Also there’re some adjustments in block sell, but still the block sells were too large, not good to me.
2.0.0 Volatility Index (Daily), 3 reversal bars in row, so still could rebound further. As some have asked what about VIX and SPX both up 3 days in a row? Well, except for today the last 3 times were 08/27/2003, 06/05/2003, 06/04/2003, market want up thereafter.
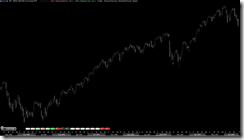
Another special stuff for today is that SPY is now up 9 days in a row. The chart below shows the only 2 similar cases since 2002 (see red bar). The sample is too few so says nothing I think.
1.0.9 SPX Cycle Watch (60 min), the cycle still is valid to me, let’s see tomorrow.
STOCK SCREENER: For fun only, I may not actually trade the screeners. Since SPY ST Model is in BUY mode, only LONG candidates are listed. For back test details as well as how to confirm the entry and set stop loss please read HERE. Please make sure you understand the basic risk management HERE.
Since the intermediate-term direction is not clear, so no stock screeners from now on until the dust settles.


