|
||||||||||||||||||||||||||||
|
||||||||||||||||||||||||||||
|
||||||||||||||||||||||||||||
|
*Please make sure you understand how to use the table above. The main purpose of this report is to provide information so contradictory signals are always presented.
*Skip the SEASONALITY and CYCLE ANALYSIS sessions below if you think they’re superstitious.
SEASONALITY: THE FIRST HALF OF THE WEEK IS GENERALLY BULLISH
See 03/12 Market Recap for details.
CYCLE ANALYSIS: EXPECT A CYCLE TOP WITHIN THIS WEEK
See 03/12 Market Recap for details.
There’re 3 cycles due today, all look like a top.
1.0.7 SPX Cycle Watch (Daily). The chart below has removed all other cycles that are not related to nowadays for cleaner views.
1.0.8 SPX Cycle Watch (Moon Phases).
1.0.9 SPX Cycle Watch (60 min). The chart below has removed all other cycles that are not related to nowadays for cleaner views.
INTERMEDIATE-TERM: EXPECT CORRECTION TO CONFORM THE PAST II PATTERN, NOT SURE WHEN IT STARTS
See 03/12 Market Recap for details.
SHORT-TERM: SPX PULLBACK IN 3 DAYS FOR 40 PLUS POINTS?
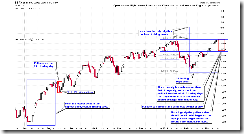
Although SPX closed eventually in green today but the daily chart doesn’t look good (I mean short-term). 0.0.5 QQQQ Short-term Trading Signals, QQQQ daily chart should be more clear for 2 reversal bars in a row. At least it should mean something, shouldn’t it?
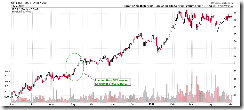
The chart below marked all the past cases (since the March 2009 rally) whenever a QQQQ black bar was confirmed by a red day the next day. All but one cases were at least not far away from a short-term top. I think you should’ve noticed the BEARISH row in the table above, simply there’re too many top signals accumulated, and it could be more if the market keeps rising tomorrow, so I think chances are little bit lower we’re experiencing yet another exception this time.
The chart below is purely speculation, for fun only, so that I can use today’s title to catch your eyes because people are losing interests in reading stock market analysis (well, I swear, this blog is an exception, I don’t see any reduced traffic yet but neither any increase in traffics too. Thank you my dear readers!) since the only thing the market is doing is to up and up and up. And yeah, I got you! Anyway, the bottom line, at least a pullback is very close now. The main logic behind the chart below is the rally nowadays is very similar to that of July the last year in terms of trading days, both are around 25 trading days, but in terms of the size of the rally, now is much weaker than that of the July. Since on the 28th trading day the SPX pulled back for about 40 points in July the last year, then I guess I could assume that within 3 days (since we’re at the 25th trading day now), SPX would start a 40 points pullback.
As mentioned in today’s After Bell Quick Summary, SPY tied a historical record for being up 12 days in a row. The chart below shows the previous record in 1995. For info only, don’t want to imply anything.
STOCK SCREENER: For fun only, I may not actually trade the screeners. Since SPY ST Model is in BUY mode, only LONG candidates are listed. For back test details as well as how to confirm the entry and set stop loss please read HERE. Please make sure you understand the basic risk management HERE.
Looks like it’s too late to long stocks now as the market is way too overbought. Waiting for a better chance.

