|
||||||||||||||||||||||||||||
|
||||||||||||||||||||||||||||
|
||||||||||||||||||||||||||||
|
*Please make sure you understand how to use the table above. The main purpose of this report is to provide information so contradictory signals are always presented.
*Skip the SEASONALITY and CYCLE ANALYSIS sessions below if you think they’re superstitious.
SEASONALITY: THE FIRST HALF OF THE WEEK IS GENERALLY BULLISH
See 03/12 Market Recap for details.
CYCLE ANALYSIS: EXPECT A CYCLE TOP WITHIN THIS WEEK
See 03/12 Market Recap for details. The SPX daily cycle mentioned yesterday, still valid and look like a top. See 1.0.7 SPX Cycle Watch (Daily).
INTERMEDIATE-TERM: EXPECT CORRECTION TO CONFORM THE PAST II PATTERN, NOT SURE WHEN IT STARTS
See 03/12 Market Recap for details.
SHORT-TERM: MYHGH NEW HIGH MEANS A NEW HIGH AHEAD BUT COULD BE A LITTLE WEAKNESS IN VERY SHORT-TERM
Two more top signs today and also lots of statistics I saw all point to a short-term pullback (Intermediate-term is up however), unfortunately so far nothing worked. Since TA is based on the principle that history repeats itself, while we’re now making a history, as so far SPY has been up 14 days in a row, so I’m not sure how long does it take before some of the bearish signals in the table above actually work, therefore if you followed my recommendation shorted on 03/12 before the close while didn’t cover on 03/15, then please make sure you have a stop loss and try your best not to average down unless you’re 1000% sure. For me, the risk control is always the number one, there’s no thing is a sure thing in the trading world, no matter how many signals support your view that worked perfectly in the past.
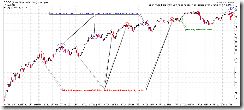
As mentioned in today’s After Bell Quick Summary, the NYHGH (NYSE 52 Week Highs) reached the 5th record high which as someone had already commented, means a new high ahead. That’s true, see zoomed out chart below for the past 5 record highs. Normally, a negative divergence must be formed on NYHGH first before any meaningful pullbacks while till now we cannot say that NYHGH has reached its highest point, so still sometimes to go before the market actually tops. Of course, from the chart we can see, if today turns out to be the NYHGH highest point then within a very short time, SPX will close below today’s close.
Today, 2 of the sentimentrader’s most important indicators reached their recent bearish extremes. Also, as mentioned in the last night’s report, seasonality wise, today is the last bullish day in March (See 03/12 Market Recap). Well, let’s wait and see.
And the “QQQQ black bar confirmed by a red bar the next day” pattern still looks valid today.
STOCK SCREENER: For fun only, I may not actually trade the screeners. Since SPY ST Model is in BUY mode, only LONG candidates are listed. For back test details as well as how to confirm the entry and set stop loss please read HERE. Please make sure you understand the basic risk management HERE.
Looks like it’s too late to long stocks now as the market is way too overbought. Waiting for a better chance.


