|
||||||||||||||||||||||||||||||||||||||||||||||||||||||||||||||||||||||||||||||||
|
||||||||||||||||||||||||||||||||||||||||||||||||||||||||||||||||||||||||||||||||
|
*Please make sure you understand how to use the table above. The main purpose of this report is to provide information so contradictory signals are always presented.
SEASONALITY: APRIL IS THE BEST MONTH FOR THE DOW
According to the Stock Trader’s Almanac, April is the best month for the Dow, average 1.9% gain since 1950. See 04/01 Market Recap for the April Seasonality chart.
CYCLE ANALYSIS: CYCLE TOP AROUND 04/01, COULD PULLBACK TO AROUND 04/12
See 04/01 Market Recap, originally I thought the market could be topped around 04/01 then pullback to around 04/12. I’ll give another day or two for this cycle to work out but looks like it could be wrong AGAIN.
INTERMEDIATE-TERM: EXPECT ROLLER COASTER AHEAD
Nothing new, according to the II Survey, too many people expected a correction, so the stock market should rise to a new high first before actually pulling back. Basically, my guess is that we’ll repeat the year 2004 roller coaster pattern. See 03/19 Market Recap for more details.
SHORT-TERM: MORE BEARISH EXTREMES
Bearish extremes keep piling up. I have no idea when they will work, but sooner or later they sure will and the result won’t be pleasant. Take a look at today’s After Bell Quick Summary if you haven’t done so because today is an All Up Day.
8.1.5 Normalized CPCE, the so called “normalized” is to use the spread between MA(10) and MA(200) instead of using the absolute value so as to eliminate the bias the equity put/call ratio exhibits depending on what type of market we are in, therefore the effectiveness is better than simply using CPCE MA(5) and MA(10). However since different method of measuring CPCE has different time frame so I’ve listed all these 3 charts in the table above.
Indicators at extremes from sentimentrader, around 35% of the sentimentrader indicators are now at bearish extreme which is too high.
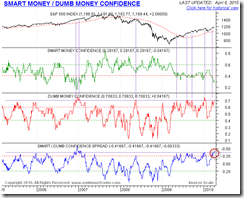
Smart money/dumb money confidence from sentimentrader, dumb money confidence as well as the spread between the smart money and dumb money is too high.
Rydex % of sectors with assets > MA(50) from sentimentrader, in other word is that the retailers are very bullish.
STOCK SCREENER: For fun only, I may not actually trade the screeners. Since SPY ST Model is in BUY mode, only LONG candidates are listed. For back test details as well as how to confirm the entry and set stop loss please read HERE. Please make sure you understand the basic risk management HERE.
Looks like it’s too late to long stocks now as the market is way too overbought. Waiting for a better chance.


