|
||||||||||||||||||||||||||||||||||||||||||||||||||||||||||||||||||||||||||||||||
|
||||||||||||||||||||||||||||||||||||||||||||||||||||||||||||||||||||||||||||||||
|
*Please make sure you understand how to use the table above. The main purpose of this report is to provide information so contradictory signals are always presented.
SEASONALITY: APRIL IS THE BEST MONTH FOR THE DOW
According to the Stock Trader’s Almanac, April is the best month for the Dow, average 1.9% gain since 1950. See 04/01 Market Recap for the April Seasonality chart.
CYCLE ANALYSIS: CYCLE TOP COULD BE AROUND 04/11 TO 04/15
As mentioned in today’s After Bell Quick Summary there’s a good chance that the SPX could close in green tomorrow (the chance for a new high is higher than eventually close in green). However, because there’re simply too many bearish extremes, so I don’t expect it to up much, so this could mean that the market consolidates into the next week. The next week, we have 04/11 to 04/15 as very important time windows so there’re chances that the cycle top could be in the next week. Yes, I’ve been changing the cycle top from around 03/09 to 04/12, this is the sad nature of the cycle analysis – the date due could be a turning point, if not, then the next cycle due date could be the turning point. Now looks to me the next possible turning point is around 04/11 to 04/15. Well, we’ll see.
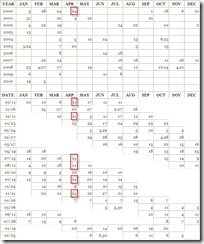
04/11, 04/14, 04/15 all are repeated multiple times in the Gann Day table below.
04/12 is 50% of the 2002 low to 2007 high 5 year cycle, so it could be an very important time resistance.
INTERMEDIATE-TERM: EXPECT ROLLER COASTER AHEAD
Nothing new, according to the II Survey, too many people expected a correction, so the stock market should rise to a new high first before actually pulling back. Basically, my guess is that we’ll repeat the year 2004 roller coaster pattern. See 03/19 Market Recap for more details.
SHORT-TERM: BEARISH EXTREMES WENT FURTHER EXTREME
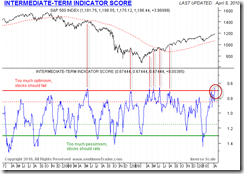
Nothing new, in 04/06 Market Recap, I mentioned 2 comprehensive indicators from the sentimentrader, Smart Money/Dumb Money Confidence and Indicators at Extremes, they went further extreme today. Also another comprehensive indicator, Intermediate-term Indicator Score is very extreme now, which combines all the sentimentrader intermediate-term indicators together.
STOCK SCREENER: For fun only, I may not actually trade the screeners. Since SPY ST Model is in BUY mode, only LONG candidates are listed. For back test details as well as how to confirm the entry and set stop loss please read HERE. Please make sure you understand the basic risk management HERE.
Looks like it’s too late to long stocks now as the market is way too overbought. Waiting for a better chance.


