|
||||||||||||||||||||||||||||||||||||||||||||||||||||||||||||||||||||||||||||||||
|
||||||||||||||||||||||||||||||||||||||||||||||||||||||||||||||||||||||||||||||||
|
*Please make sure you understand how to use the table above. The main purpose of this report is to provide information so contradictory signals are always presented.
SEASONALITY: MOSTLY THE MONTH’S LAST TRADING WEEK WAS RED SINCE AUG 2009
See 04/23 Market Recap for more details.
CYCLE ANALYSIS: THE NEXT IMPORTANT DATE IS 05/06
The next potential turn date is 05/06 (+-) which could either be a top or a bottom depending on how the market marches to that date. See 04/16 Market Recap for more details.
INTERMEDIATE-TERM: EXPECT ROLLER COASTER AHEAD
Although so far the earnings season appears OK (I was expecting sell on news), but still maintain the forecast for a roller coaster intermediate-term ahead. Two major reasons:
6.1.0 Extreme CPCE Readings Watch, see blue dashed lines, extremely low CPCE means a choppy ahead.
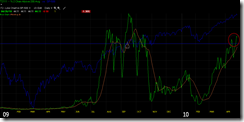
T2111 from Telechart, percent of stocks 2 std dev above MA(200) is a little bit too high. See the blue curve representing SPX, it becomes very choppy whenever T2111 is too high (above the blue horizontal line).
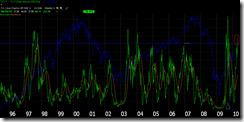
From the weekly T2111 below we can see that the current T2111 reading is at very extreme level which in the past also means a choppy market ahead.
SHORT-TERM: EXPECT A NEW HIGH AHEAD BUT MAY SEE SOME SHORT-TERM WEAKNESS FIRST
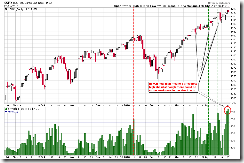
As mentioned in the 04/23 Market Recap, whenever NYHGH (NYSE New 52 Week Highs) is extremely high, a red day is more like the next day. However the market could only be topped when a negative divergence is formed on the NYHGH first, so accordingly the NYHGH new high means SPX will have a new high ahead. Today we saw a new high and got a red day therefore conforming the pattern. As of tomorrow, we might see a similar pattern (a red day and a SPX new high tomorrow or some day later) because the NYHGH reached a new high again today.
6.4.3a SPY Bearish Reversal Day Watch, by definition today is a bearish reversal day although the gap up in the morning was a little too small. Anyway, the chart also argues for a short-term weakness, expect either pullback or consolidation ahead.


