|
||||||||||||||||||||||||||||||||||||||||||||||||||||||||||||||||||||||||||||||||||||||||
|
||||||||||||||||||||||||||||||||||||||||||||||||||||||||||||||||||||||||||||||||||||||||
|
*Please make sure you understand how to use the table above. The main purpose of this report is to provide information so contradictory signals are always presented.
*DTFMS = Dual Time Frame Momentum Strategy. The signal is given when both weekly and daily STO have the same buy/sell signals. Use it as a filter, don’t trade directly.
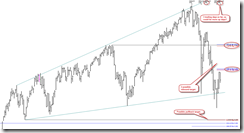
CHANGE NOTE: I’ve removed all the cycle related charts in my public chart list because it’s a little bit difficult to maintain the cycle chart in stockcharts, besides stockcharts doesn’t have the calendar day mode. So from now on I’ll use other software to do the time analysis (Screenshot below to tell you that I’m very serious in time analysis as it’s just one piece of my many time analysis charts). For your convenience, I’ve added time related rows in the table above. The benefit for doing this is if the date deduced from various angles happens to be the same date, then it could be highlighted to imply its importance. For example, now, 06/06 (+-) is shown simultaneously via different method, so it should be very convincing that it’s a date of some importance.
SEASONALITY: THE FIRST TRADING DAY IN JUNE IS BULLISH AND THE MEMORIAL DAY WEEK IS BULLISH
According to the Stock Trader’s Almanac, the first trading day in June, Dow up 9 of last 11.
The chart below is from Bespoke, looks like the next week (Memorial Day week) is bullish.
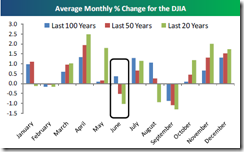
Again the chart below is from Bespoke, June has been the 2nd worst month of the year over the last 20 years.
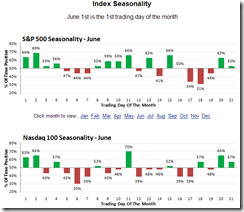
The June seasonality chart below is from sentimentrader.
INTERMEDIATE-TERM: MAIN PULLBACK TARGET AROUND 1008 TO 1019, II SURVEY MAY MEAN A HUGE REBOUND AHEAD
Temporarily maintain the intermediate-term target around 1008 to 1019 (See 05/21 Market Recap for more details).
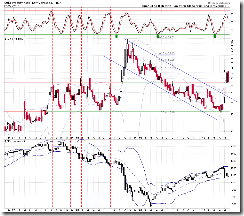
Why “temporarily”? Because the II Survey below again shows too many people are expecting a correction. I hope you still remember that in the January correction, also because II Survey shows there’re too many people expecting a correction, so my guess at that time was we might see huge rebound, even new high before the real correction. So far the II correction pattern worked amazingly (see red vertical lines). So will it work again this time – a big rebound ahead? Well, I have no idea, I just want you to know that it’s possible especially there’re so many bottom signals pilled up in the table above.
Trading wise, because SPY ST Model and Non-Stop Model are still in sell mode, so the strategy is still to sell the bounce. However since now we know it’s possible that the market may rebound huge, so don’t be too aggressive in selling the bounce. Personally, I’ll add into or initial a new position only when my first position is profitable, with absolutely no average down. In this way, if the selling bounce is wrong, I won’t lose too much.
WARNING: If you don’t understand the true meaning of overbought/oversold, please skip the session below. Generally, you should try your best not to trade against the trend. Trading purely based on overbought/oversold while against the trend is lethal to the health of your account. Before going further, please make sure you understand how to use the table above.
SHORT-TERM: COULD REBOUND TO AROUND 06/06 (+-), SPY TARGET $114.40
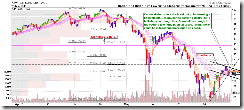
Still expect a short-term rebound. Maintain the time and target mentioned in 05/27 Market Recap. The chart below uses the Fib confluences area to calculate the possible target. Both time and target also fit what I’ve mentioned in 05/27 Market Recap.
I’ve found as much as 7 EXCUSE to expect a rebound:
1. As mentioned in the seasonality session above, the first trading day in June and the Memorial day week are bullish.
2. Table above has accumulated too many bottom signals. All those signals have survived a lot of market extremes and proven to be reliable.
3. 1.0.0 S&P 500 SPDRs (SPY 60 min), as mentioned in 05/28 After Bell Quick Summary, could be a Bull Flag in the forming.
4. 0.1.0 SPY Short-term Trading Signals, for 3 times in a row, white bull bar is larger than the red bear bar which means bears are weaker because they couldn’t recover whatever has lost to the bulls in the previous day. Besides, a general rule of thumb, the market often makes 2 attempts to do something. If it fails 2 times (05/21 and 05/25), it often does the opposite, so we see the market rebounded after 05/25. Now if the market will turn down, most likely it will try 2 times to breakout above. If 05/27 is the very first try, then at least there’ll be a second try to retest the 05/27 high before rolling over.
5. In 05/24 Market Recap, I mentioned “beware of VIX weekly STO sell signal”. Now the STO sell signal is confirmed, see red dashed lines, the signal even worked in the 2008 crash.
6. 3.1.0 Currency Shares Euro Trust (FXE Daily), this is a typical breakout then pullback to kiss the channel good bye pattern, it’s a long setup, so euro could rebound which is good for the stock market.
7. If interested, click the links to take a look at some weekly charts. Lot’s of weekly Hammer formed which means bullish reversal 60% of the time: 4.1.1 Nasdaq 100 Index (Weekly), 4.1.2 Russell 2000 iShares (IWM Weekly), 4.1.6 iShares MSCI Emerging Markets (EEM Weekly), 3.4.1 Real Estate iShares (IYR Daily), 3.4.2 Materials Select Sector SPDR (XLB Daily).


