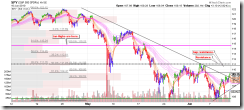
OK, bottomed? I wish I knew. From the SPY intraday chart we have higher high and higher low in the past 3 days, that looks promising, and from the SPY daily chart we have higher low (the 06/08 low is higher than 05/25 low), that’s hopeful. Now let’s see if bull could break through the multiple resistances above to make its very first higher high on the SPY daily chart.

- Getting Started
- Quick Start Guide
- Registration Tutorial
- 3 Different Login System
- We serve mobile contents
- Private Messaging System
- Your safety is my primary concern
- FAQs
- Lost 25%, can I follow you to regain all
- I cannot log in, please help!
- I don’t have PayPal account, can I still be a subscriber
- How to update credit card info
- How to know if I paid with PayPal or via credit card directly
- Payment Skips and Suspension
- How to find a chart in my public chart list
- Could you recommend some trading books
- Chart Legend and Back Test Rules
- Short, intermediate and long term
- Trading School
- Seasonality
- Seasonality by Month and Day
- Holiday Seasonality
- Others
- Average Quarterly Percent Change for Dow
- Trading Thanksgiving Week
- December OE Week Historically Bullish
- Quadruple Witching Expiration Week Bullish
- 5-Week Expiration Cycles
- Christmas Week and New Year Week
- Presidential Cycle Years
- Election Year Dow Returns by Party and Term
- Holiday Weeks
- Martin Luther King, Jr. Week
- January Barometer
- Leap Day Performance
- Sell on Rosh Hashanah and Buy on Yom Kippur
- Up 5-15% YTD Heading Into December
- Last and First Trading Day of Year
- Santa Rally, First Five Days and January Barometer
- First Day of Month
- As Goes IBM, So Goes the Market
- AAII Many Consecutive Weeks of More Bears than Bulls
- AAII Bullish Readings and Market Performance
- Performance after Running Across Even Levels
- Gold Golden Crosses
- Gann Pivot Date
- Resources
- Quick Links, to be Edited
- Free Commentry
- Login
- Signup
- Contact Us
Select Page
