|
||||||||||||||||||||||||||||||||||||||||||||||||||||||||||||||||||||||||||||||||||||
|
||||||||||||||||||||||||||||||||||||||||||||||||||||||||||||||||||||||||||||||||||||
|
*Please make sure you understand how to use the table above. The main purpose of this report is to provide information so contradictory signals are always presented.
*DTFMS = Dual Time Frame Momentum Strategy. The signal is given when both weekly and daily STO have the same buy/sell signals. Use it as a filter, don’t trade directly.
SEASONALITY: A LITTLE BIT BULLISH ON JUNE TRIPLE WITCHING WEEK
See 06/11 Market Recap for more details.
INTERMEDIATE-TERM: INITIAL REBOUND TARGET AROUND 1150 AND TIME TARGET AROUND 06/24
See 06/14 Market Recap for more details.
SHORT-TERM: A LITTLE BIT NERVOUS FOR THE 2ND REVERSAL LIKE BAR IN 3 DAYS
As mentioned in today’s After Bell Quick Summary because SPY ST Model is now in buy mode, so for me (pay attention to FOR ME, as I said treat the model as a joke), officially the intermediate-term is up, the game is to buy dips. However, I also mentioned that I don’t feel good about tomorrow, maybe I’m too nervous, but here are the reasons:
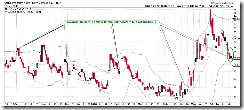
0.2.0 Volatility Index (Daily), the solid black bar (Open > Close but Close > Yesterday’s Close) today usually means a reversal, plus the Monday’s hollow red bar (Open < Close but Close < Yesterday’s Close) which also means a possible reversal. So VIX may rebound which is not good for SPX.
0.2.1 10Y T-Bill Yield, identical to VIX, 2 reversal like bars within 3 days.
0.1.0 SPY Short-term Trading Signals, the hollow red bar today doesn’t look good, plus a bunch of overbought signals.
So to summarize, I don’t feel good about tomorrow, but I’m not sure if we’ll see a big pullback because from the past experiences, the initial rebound from a bottom usually is very strong that no overbought signals would ever work for awhile, I’m not sure if we’re indeed in this kind of strong rebound phase. Basically, if we do see a pullback tomorrow, as long as the Double Bottom neckline below at 111.06 could hold, then the Double Bottom pattern is still valid and therefore the market is bullish. Well, we’ll see.


