|
||||||||||||||||||||||||
|
||||||||||||||||||||||||
|
*Please make sure you understand how to use the table above. The purpose of this report is to provide info so contradictory signals are always presented.
SEASONALITY: BEARISH EARLY NEXT WEEK, BULLISH LATER
See 08/27 Market Recap for more details.
INTERMEDIATE-TERM: STATISTICS ARE BEARISH, THE NEXT PIVOT DATE IS AROUND 09/07 TO 09/10
See 08/27 Market Recap for more details.
SHORT-TERM: TICK MA(3) TOO HIGH, COULD SEE PULLBACK SOON
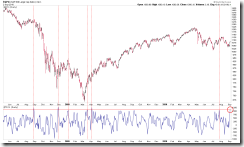
A very unique thing today is that TICK MA(3) is extremely high which means at least a short-term pullback is due very soon.
Tomorrow is Non Farm Payroll day again. I’ve mentioned lots about the usual pattern of this day – open high may close lower while open low may close higher. For more details please take a look at 08/05 Market Recap. The only thing I want to remind you is if unfortunately a red day tomorrow, then be careful about a possible trend change as my next pivot date around 09/07 to 09/10 may indeed come true.
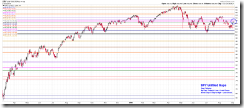
The chart below is interesting because it was exactly the same I mentioned on 08/05 Market Recap: If gap down unfilled tomorrow then the gap will be filled within days because back to back unfilled gaps are very rare, at least not seen on the chart below. Therefore if indeed we have a gap down unfilled tomorrow which as mentioned above could mean a possible trend change (since it automatically means a red day), no need to worry, because the gap will be filled very soon which guarantees that bulls will have chances to escape unharmed.
The chart below explains what I mean “back to back unfilled gap”.
HIGHLIGHTS OF THE OTHER ETFS IN MY PUBLIC CHART LIST
| TREND | DTMFS | COMMENT – *New update. Click BLUE to see chart if link is not provided. | |
| QQQQ | DOWN | ||
| IWM | DOWN | BUY | |
| CHINA | UP | Head and Shoulders Bottom in the forming? | |
| EMERGING | DOWN | 4.1.6 iShares MSCI Emerging Markets (EEM Weekly): EEM to SPX ratio too high. | |
| EUROPEAN | DOWN | ||
| CANADA | UP | BUY | |
| BOND | UP | *SELL | 4.2.0 20 Year Treasury Bond Fund iShares (TLT Weekly): Too far away from MA(200). |
| EURO | DOWN | *6.4.5 GLD and UUP Watch: GLD black bar means US$ rebound tomorrow? | |
| GOLD | UP | ||
| GDX | UP | 4.3.1 Market Vectors Gold Miners (GDX Weekly): GDX to SPX ratio too high. | |
| OIL | DOWN | ||
| ENERGY | DOWN | ||
| FINANCIALS | DOWN | *BUY | 4.4.2 Financials Select Sector SPDR (XLF Weekly): Head and Shoulders Top in the forming? |
| REITS | DOWN | BUY | 4.4.3 Real Estate iShares (IYR Weekly): Home builder is lagging, be careful. |
| MATERIALS | DOWN | *BUY |
*DTFMS = Dual Time Frame Momentum Strategy. The signal is given when both weekly and daily STO have the same buy/sell signals. Use it as a filter, don’t trade directly.


