|
||||||||||||||||||||||||
|
||||||||||||||||||||||||
|
SHORT-TERM: BULLISH BUT STILL EARLY TO DECLARE BEARS DEAD
Still my old saying, as long as we still live on Earth then most likely the Friday’s price action wouldn’t be an one day wonder, because “A forward accelerating car has to be slow down first before it could be reversed”, so chances are good that the intermediate-term’s 2nd or 3rd (if you count 08/27 to 09/03 as the first leg up) leg up has started. However, since there’re still lots of bad signs left summarized in 09/23 Market Recap, plus the seasonality is not bull friendly (see seasonality session below) the next week, so it’s still early to declare bears dead. Let’s see if bears would strike back the next week before blah blah how we could retire earlier.
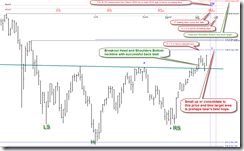
The chart pattern looks like a Head and Shoulders Bottom breakout then back test neckline. Therefore as long as the 09/23 low at 1122 holds, the Head and Shoulders Bottom will be as real as it gets with the text book target at 1242 and 74% chances being fulfilled. The bear’s hope is via the bearish seasonality the next week, to turn the tide at around 1158 and time window from 09/28 to 10/01 to form a typical A = C pattern.
Remember the “pullback usually begins with 3 consecutive down days” mentioned in 09/23 Market Recap? The chart below is bear’s another hope if only the market could consolidate the next week. In another word is, up huge the next week, then gone the bear’s last hope.
Since SPX did have a 3 days pullback from 09/21 to 09/23, so my previous forecast for a short-term pullback is somewhat partially fulfilled. The table below summarized all the bullets used and left for bears. As you can see, there’re still some hopes for bears.
| BAD SIGNS | RESULT |
| 09/21 to 09/23 pivot date in 09/17 Market Recap | Fulfilled |
| 6.4.3a SPY Bearish Reversal Day Watch on 09/21 | Fulfilled |
| VIX leads SPX mentioned in 09/21 Market Recap | Fulfilled |
| 6.5.1a SPX and FOMC, red FOMC followed by a red day | Fulfilled |
| 6.3.1b Major Accumulation Day Watch, 2 consecutive red days after MAD | Fulfilled |
| 1.1.1 PowerShares QQQ Trust (QQQQ Daily), 2 hollow red bars | Not Confirmed |
| 1.0.6 SPY Unfilled Gaps, 18 unfilled gaps | |
| AAII is too bullish in 09/23 Market Recap | |
| SPX down 3 consecutive days means more pullbacks in 09/23 Market Recap | |
| 6.5.2b Month Day Seasonality Watch, 6.5.2c Week Seasonality Watch, bearish next week | |
| 6.1.9a Extreme ISEE Index Readings Watch, ISEE Indices & ETFs Only Index > 100 |
A very unique thing last Friday was that SPX rose more than 2% but it’s not a Major Accumulation Day. A reader has asked for the consequences. Well, the back test result shows no edges except sell at Monday open (best if Monday could gap up which would be its 19th gap if unfilled) and cover before close, there’re 65% chances since year 2000.
Because the volatility in 2008 was huge so a rebound of more than 2% but not a Major Accumulation Day may mean nothing, so maybe I shouldn’t count that period. The chart below shows what happened since March 2009, I still don’t see much edge except it only proves that a red the next day is high likely.
INTERMEDIATE-TERM: STATISTICALLY BULLISH FOR THE NEXT WEEK
We could see 2 to 3 legs up while now is the 2nd leg up. See 09/17 Market Recap for the back test.
The chart below is an update to the 09/17 Market Recap back test: Down 3 consecutive weeks then up 4 consecutive weeks, buy at Friday’s close sell 1, 2, 3, 4 weeks later, it seems the next, the next next, the next next next week are not bad.
SEASONALITY: LAST TRADING WEEK OF MONTH WAS GENERALLY BEARISH
According to Stock Trader’s Almanac:
- Last day of Q3, Dow down 8 of last 12, massive 4.7% rally in 2008.
- First trading day in October, NASDAQ up 5 of last 7.
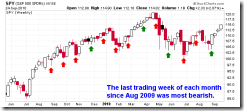
6.5.2c Week Seasonality Watch, last trading week of every month since August 2009 was generally bearish.
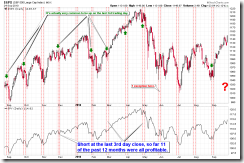
6.5.2b Month Day Seasonality Watch, the last 2 trading days of every month since August 2009 were generally bearish.
HIGHLIGHTS OF THE OTHER ETFS IN MY PUBLIC CHART LIST
| TREND | COMMENT | |
| QQQQ | *UP | 4.1.1 Nasdaq 100 Index (Weekly): NDX to SPX ratio too high. |
| IWM | *UP | *Morning Star? |
| CHINA | ||
| EMERGING | *UP | 4.1.6 iShares MSCI Emerging Markets (EEM Weekly): EEM to SPX ratio too high. |
| CANADA | *UP | TOADV MA(10) too high, pullback? *Morning Doji Star, more rebound? |
| BOND | *DOWN | *4.2.0 20 Year Treasury Bond Fund iShares (TLT Weekly): Morning Doji Star? |
| EURO | UP | |
| GOLD | UP | *Black Bar. |
| GDX | LA | 4.3.1 Market Vectors Gold Miners (GDX Weekly): GDX to SPX ratio too high and Bearish Engulfing. *3.2.1 Market Vectors Gold Miners (GDX Daily): Bearish Engulfing? |
| OIL | *UP | Bullish reversal bar, rebound? |
| ENERGY | *UP | *Morning Star? |
| FINANCIALS | *UP | 4.4.2 Financials Select Sector SPDR (XLF Weekly): Head and Shoulders Top in the forming? |
| REITS | *UP | 4.4.3 Real Estate iShares (IYR Weekly): Home builder is lagging. |
| MATERIALS | *UP |
- Please make sure you understand how to use the table above. The purpose of this report is to provide info so contradictory signals are always presented.
- Conclusions can be confirmed endlessly, but trading wise, you have to take actions at certain risk level as soon as you feel the confirmation is enough. There’s no way for me to adapt to different risk levels therefore no specific buy/sell signals will be given in this report except the mechanical signals such as SPY ST Model.
- * = New update.
- Blue Text = Link to a chart in my public chart list.
- LA = Lateral Trend.


