|
||||||||||||||||||||||||
|
||||||||||||||||||||||||
|
SHORT-TERM: EXPECT PULLBACK SOON BUT IT MIGHT JUST BE A TEMPORARY TOP
The market is a little bit overbought, not enough for me to officially use overbought as the title though. Some old readers may remember that I don’t use overbought as the title easily because all the overbought signals I watch are not normal signals therefore they’re quite reliable (so don’t tell me overbought can be more overbought, just search my past record to see what happened when I officially used overbought as the title. The most recent time I used overbought as the title was in 07/26 Market Recap). The purpose I mention the potential overbought in advance today is to remind bulls, especially if the market can manage another up day tomorrow, better take some profits as a pullback shall be imminent. Of course, the pullback, if indeed, most likely is just a short-term pullback.
Now let’s take a look at some of my so called not normal overbought signals.
Percent of SPX stocks 1 std dev above MA(50), the signal was originated from Bespoke. See highlighted in red, they’re all very close to a short-term top while today’s reading is the highest among them.
T2112, NYSE percent of stocks 2 std dev above MA(40), the horizontal blue line is the all time high before year 2009 and now we’re very close.
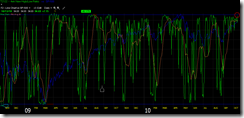
T2122, NYSE 4-week New High/Low Ratio, this is my ultimate weapon for watching overbought, now is very close to an extreme level.
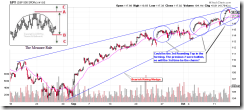
1.0.0 S&P 500 SPDRs (SPY 60 min), chart pattern wise, a huge Bearish Rising Wedge could be in the forming which is pretty reliable as both top and bottom trend lines are 3 points validated. Besides, a 3rd Rounding Top could be in the forming, which if indeed the 3rd time is the charm, since the previous 2 were bullish Rounding Top, so the 3rd one could be bearish.
6.2.2a VIX Trading Signals (BB), this is to follow up what I mentioned in 10/11 After Bell Quick Summary, the SPX short setup was triggered today. Please refer to 04/13 Market Recap for back test results.
INTERMEDIATE-TERM: BEARISH BIASED
Maintain the intermediate-term bearish view. Below are summaries of all the arguments I’ve been blah blah recently:
- As mentioned in 10/08 Market Recap, commercial (smart money) holds record high short positions against Nasdaq 100.
- As mentioned in 10/08 Market Recap, AAII bull ratio (4-week average) is way too bullish.
- As mentioned in 10/08 Market Recap, institution selling keeps increasing.
- As mentioned in 10/08 Market Recap, statistically, a strong off-season could mean a weaker earning season.
SEASONALITY: OCTOBER EXPIRATION MONAY WAS BULLISH, EXPIRATION DAY WAS BEARISH
According to Stock Trader’s Almanac:
- Monday before October expiration, Dow up 24 of 29.
- October expiration day, Dow down 4 straight and 5 of last 6.
For October Seasonality chart please refer to 10/01 Market Recap.
HIGHLIGHTS OF THE OTHER ETFS IN MY PUBLIC CHART LIST
| TREND | COMMENT | |
| QQQQ | UP | 4.1.1 Nasdaq 100 Index (Weekly): NDX to SPX ratio too high. |
| IWM | UP | |
| CHINA | Confirmed breakout, very bullish. | |
| EMERGING | UP | 4.1.6 iShares MSCI Emerging Markets (EEM Weekly): EEM to SPX ratio too high. |
| CANADA | UP | TOADV MA(10) too high. |
| BOND | DOWN | *Hollow red bar, rebound? |
| EURO | UP | |
| GOLD | UP | |
| GDX | UP | 4.3.1 Market Vectors Gold Miners (GDX Weekly): GDX to SPX ratio too high. |
| OIL | *UP | |
| ENERGY | UP | |
| FINANCIALS | UP | 4.4.2 Financials Select Sector SPDR (XLF Weekly): Head and Shoulders Top in the forming? *3.4.0 Financials Select Sector SPDR (XLF Daily): Black bar under important resistance, pullback? |
| REITS | UP | 4.4.3 Real Estate iShares (IYR Weekly): Home builder is lagging. |
| MATERIALS | UP |
- Please make sure you understand how to use the table above. The purpose of this report is to provide info so contradictory signals are always presented.
- Conclusions can be confirmed endlessly, but trading wise, you have to take actions at certain risk level as soon as you feel the confirmation is enough. There’s no way for me to adapt to different risk levels therefore no specific buy/sell signals will be given in this report except the mechanical signals such as SPY ST Model.
- * = New update.
- Blue Text = Link to a chart in my public chart list.
- LA = Lateral Trend.


