|
||||||||||||||||||||||||
|
||||||||||||||||||||||||
|
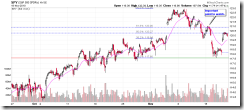
SHORT-TERM: REITERATE THAT WE’LL SEE THE 2ND LEG DOWN
Reiterate 2 leg down pattern mention in 11/16 Market Recap. The first leg down was apparently over, now the question is how far the rebound can go? I have no idea except to wait and see. Purely from Fib perspective, Fib 61.8% at 11/15 highs is wroth watching.
The biggest problem for bulls now is VIX to VXV ratio is a little low so likely the rebound wouldn’t go too far. Of course, a huge up day again tomorrow may change the story.
No other to say. SPY ST Model buy setup confirmed today so a enter long position should be entered today, however the validity problem still remains, unless huge up day again tomorrow, otherwise chances are good it will ask to close long the next Monday, so beware.
INTERMEDIATE-TERM: THE FIRST 2.5%+ PULLBACK AFTER A 40+ STRAIGHT UP TRADING DAYS WAS USUALLY A BUY
See 11/12 Market Recap for more details.
SEASONALITY: BEARISH MONDAY, BULLISH FRIDAY, BULLISH THE WHOLE WEEK
See 11/12 Market Recap for more details.
For November seasonality chart please refer to 11/11 Market Recap for more details.
HIGHLIGHTS OF THE OTHER ETFS IN MY PUBLIC CHART LIST
| SIGNAL | COMMENT | |
| QQQQ | 11/16 S | |
| NDX Weekly | UP | NASI STO(5,3,3) sell signal. |
| IWM | ||
| IWM Weekly | UP | |
| CHINA | Big red bar means more pullbacks ahead, so be careful. | |
| CHINA Weekly | UP | |
| EEM | ||
| EEM Weekly | UP | |
| XIU.TO | 11/16 S | |
| XIU.TO Weekly | UP | |
| TLT | ||
| TLT Weekly | DOWN | %B is a little too low. |
| FXE | 3.1.1 PowerShares DB US Dollar Index Bullish Fund (UUP Daily): ChiOsc is way too high. | |
| FXE Weekly | UP | |
| GLD | ||
| GLD Weekly | UP | |
| GDX | 11/16 S | |
| GDX Weekly | UP | BPGDM and GDX:SPX both are too high. Pullback? |
| USO | ||
| WTIC Weekly | UP | |
| XLE | 06/15 L | |
| XLE Weekly | UP | %B is too high with negative divergence. |
| XLF | 10/15 L | |
| XLF Weekly | UP | |
| IYR | ||
| IYR Weekly | UP | Home builders are lagging. |
| XLB | 11/16 S | |
| XLB Weekly | UP | XLB:SPX a little too high. |
- Please make sure you understand how to use the table above. The purpose of this report is to provide info so contradictory signals are always presented.
- Position reported in short-term session of the table above is for short-term model only, I may or may not hold other positions which will not be disclosed.
- Conclusions can be confirmed endlessly, but trading wise, you have to take actions at certain risk level as soon as you feel the confirmation is enough. There’s no way for me to adapt to different risk levels therefore no trading signals will be given in this report except the mechanical signals such as SPY ST Model.
- * = New update; Blue Text = Link to a chart in my public chart list.
- Trading signals in OTHER ETFs table are mechanical signals. See HERE for back test results. 08/31 L, for example, means Long on 08/31.
- UP = Intermediate-term uptrend. Set when I see at least one higher high and higher low on weekly chart.
- DOWN = Intermediate-term downtrend. Set when I see at least one lower high and lower low on weekly chart.


