|
||||||||||||||||||||||||
|
||||||||||||||||||||||||
|
SHORT-TERM: COULD BUMP INTO SOME HEADWIND
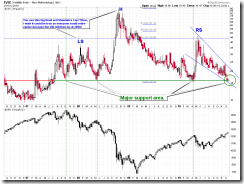
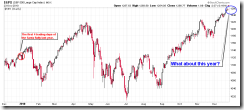
The famous Santa Rally will begin the next week, my first reflection is Bull Flag, so there’s one more push up, but it’s only on intraday chart so the one more push up may just be of an intraday scale. It’s the solid rebound of VIX that changed my view (or more precisely changed my reflection) about the next week, plus the fact the VIX is on an important support so I couldn’t help thinking that we may repeat what happened the last year: We’ve already seen the Santa Rally this week so there won’t be one the next week.
Let’s see why VIX got me worried:
It’s the big white bar got me worried, if repeats what happened recently, then we could finally see a pullback that could last for a few days.
VIX is now on an important support, if it holds then also it means SPX would have a week or two pullbacks at least.
I still remember what happened on the last year’s Santa Rally, especially the sharp drop right before the last day’s close which also backed by statistics that according to the Stock Trader’s Almanac 2011, last trading day of the year, NASDAQ down 9 of last 10.
INTERMEDIATE-TERM: COULD BE WAVE 5 UP TO SPX 1300+, PIVOT TOP COULD BE AROUND 01/05 TO 01/12
See 12/17 Market Recap for more details.
I believe most of you have already heard that the AAII Bull Ratio hit a 5 year high. See chart below. According to statistics, generally a little choppy ahead.
SEASONALITY: LAST WEEK AND THE LAST 2 TRADING DAYS OF THE MONTH WERE GENERALLY BEARISH
Seasonality, if forget about the Santa Rally, the next week should be generally bearish.
- According Stock Trader’s Almanac 2011, last trading day of the year, NASDAQ down 9 of last 10.
- The last 2 trading days of every month since August 2009 were bearish.
- 6 out of 15 times (60%) a red last week each month since August 2009.
HIGHLIGHTS OF THE OTHER ETFS IN MY PUBLIC CHART LIST
| SIGNAL | COMMENT | |
| QQQQ | 12/21 L | |
| NDX Weekly | UP | |
| IWM | ||
| IWM Weekly | UP | |
| CHINA | ||
| CHINA Weekly | UP | |
| EEM | ||
| EEM Weekly | UP | |
| XIU.TO | 12/02 L | |
| XIU.TO Weekly | UP | |
| TLT | ||
| TLT Weekly | DOWN | |
| FXE | *The 2nd test of the previous low, so there’s a chance EURO is bottomed around here. | |
| FXE Weekly | DOWN | |
| GLD | ||
| GLD Weekly | UP | |
| GDX | 12/17 S | |
| GDX Weekly | UP | |
| USO | ||
| WTIC Weekly | UP | |
| XLE | 06/15 L | |
| XLE Weekly | UP | |
| XLF | 10/15 L | |
| XLF Weekly | UP | |
| IYR | ||
| IYR Weekly | UP | Home builders are lagging. |
| XLB | 12/01 L | |
| XLB Weekly | UP | BPMATE is way too overbought. |
- Please make sure you understand how to use the table above. The purpose of this report is to provide info so contradictory signals are always presented.
- Position reported in short-term session of the table above is for short-term model only, I may or may not hold other positions which will not be disclosed.
- Conclusions can be confirmed endlessly, but trading wise, you have to take actions at certain risk level as soon as you feel the confirmation is enough. There’s no way for me to adapt to different risk levels therefore no trading signals will be given in this report except the mechanical signals such as SPY ST Model.
- * = New update; Blue Text = Link to a chart in my public chart list.
- Trading signals in OTHER ETFs table are mechanical signals. See HERE for back test results. 08/31 L, for example, means Long on 08/31.
- UP = Intermediate-term uptrend. Set when I see at least one higher high and higher low on weekly chart.
- DOWN = Intermediate-term downtrend. Set when I see at least one lower high and lower low on weekly chart.


