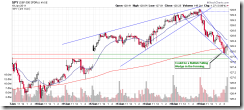
The bottom line, the short-term trend is down, not confirmed though. I closed the intraday short and longed before the close for speculation play only – betting the normally reversal of reversal of reversal.
Chart pattern wise, could be a Bullish Falling Wedge in the forming, so at least we could see some strength tomorrow morning (may test today’s low first though). On the other hand, bears finally get a lower low (well, barely), the question is: will it get a lower high to confirm a 1-2-3 Trend Change? That’s we’re going to find out for the rest of the week. Until then, the game is still, well, you know…
Demo account for short-term model, $200 max loss allowed per trade. Mechanical trading signal, for fun only.
| TICKER | Entry Date | Entry Price | Share | Stop Loss | Exit Date | Exit Price | Profit | Comment |
| SSO | 01/19/2011 | $49.81 | 100 | $48.86 | Speculation play, half positioned. | |||
| SDS | 01/19/2011 | $22.77 | 500 | $22.34 | 01/19/2011 | $22.91 | 70.00 | |
| SSO | 01/14/2011 | $50.06 | 50 | $50.73 | 01/19/2011 | $50.73 | 33.50 | |
| SSO | 01/14/2011 | $50.06 | 150 | $48.86 | 01/14/2011 | $50.65 | 88.50 | |
| SSO | 01/12/2011 | $49.91 | 100 | $48.25 | 01/12/2011 | $50.11 | 20.00 | |
| SSO | 01/11/2011 | $49.20 | 100 | $48.25 | 01/12/2011 | $50.02 | 82.00 | |
| SSO | 01/11/2011 | $49.20 | 100 | $48.25 | 01/11/2011 | $49.24 | 4.00 | Risk control, half position out. |
| SSO | 01/10/2011 | $48.98 | 100 | $47.65 | 01/11/2011 | $49.38 | 40.00 | |
| SSO | 01/06/2011 | $49.26 | 100 | $48.29 | 01/07/2011 | $48.28 | -98.00 | Stop loss. |
| SSO | 01/06/2011 | $49.26 | 100 | $48.29 | 01/07/2011 | $49.50 | 24.00 | Target met, partial profit. |
| SSO | 01/04/2011 | $49.02 | 100 | $47.65 | 01/05/2011 | $49.38 | 36.00 | |
| SSO | 12/30/2010 | $48.02 | 100 | $48.66 | 01/04/2011 | $48.66 | 64.00 | |
| SSO | 12/30/2010 | $48.02 | 100 | $47.44 | 01/03/2011 | $49.20 | 118.00 | Partial profit. |
| SDS | 12/30/2010 | $23.88 | 400 | $23.60 | 01/03/2011 | $23.30 | -232.00 | Gap down, manual stop loss used. |
| SUM | 250.00 |

