|
||||||||||||||||||||||||
|
||||||||||||||||||||||||
|
||||||||||||||||||||||||
|
SHORT-TERM: 2.5%+ PULLBACK EITHER HAS STARTED OR NEVER
First of all, we must admit, today’s sharp gap down then sharp reversal to close in green is in general a very bullish pattern, so chances are good that the market may follow-through thereafter. So the conclusion today: "2.5%+ pullback either has started or never” is rather speculative, for fun only.
Two reasons:
- As mentioned in 02/04 Market Recap, 61 trading day is a threshold for not having 2.5%+ pullbacks, today is the 59th trading day which means if indeed we’ll have a 2.5%+ pullback, it should be within days.
- INDU has been up 7+ days in a row, the chart below shows all the past 9 such cases since year 2000. Among them, 5 out of 9, a 7+ consecutive up days was followed immediately by a 2.5%+ pullback, while the other 4 cases, there’re none. So if the history still repeats, then today should either be the start of the 2.5%+ pullback as today is the very first red day after INDU 8 consecutive up days (that 5 out 9 cases); Or we have to wait for another 89 trading days before any meaningful pullback (the other 4 cases). Besides, by the way, even indeed the pullback has started, bears better not hope too much because only 1 out of 9 cases it’s a start of a meaningful pullback while the others simply took a few days breadth. This should make sense because this is still Earth where everything complies with the law of inertia so it’s very rare that a strong up momentum like 8 consecutive up days would reverse all of sudden without slowing down first.
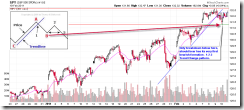
The chart below illustrates what I’ll close watch tomorrow. Still the same old blah blah, you want to be a bear, sure, but firstly, show me at least an intraday lower low (so called 1-2-3 Trend Change).
INTERMEDIATE-TERM: WHETHER THIS IS PRIMARY 3 OF 3 TO GALAXY FAR FAR AWAY WE MAY KNOW WITHIN 2 WEEKS
See 02/04 Market Recap for more details.
SEASONALITY: BEARISH THE NEXT WEEK FOR NASDAQ, FEBRUARY SEASONALITY IS GENERALLY NOT BULLISH
See 02/04 Market Recap for more details.
HIGHLIGHTS OF THE OTHER ETFS IN MY PUBLIC CHART LIST
| SIGNAL | COMMENT | |
| QQQQ | 01/28 S | |
| NDX Weekly | UP | BPNDX is way too overbought. |
| IWM | ||
| IWM Weekly | UP | |
| CHINA | ||
| CHINA Weekly | DOWN | |
| EEM | ||
| EEM Weekly | DOWN | |
| XIU.TO | 02/04 L | TOADV MA(10) is a little too high, all led to a pullback of some kind recently. |
| XIU.TO Weekly | UP | |
| TLT | ||
| TLT Weekly | DOWN | |
| FXE | ||
| FXE Weekly | UP | |
| GLD | ||
| GLD Weekly | DOWN | STO is way too oversold, led to a rebound the last 2 times. |
| GDX | 02/03 L | |
| GDX Weekly | DOWN | |
| USO | ||
| WTIC Weekly | UP | |
| XLE | 02/09 S | |
| XLE Weekly | UP | Too far above MA(200). |
| XLF | 10/15 L | |
| XLF Weekly | UP | Testing resistance which also is multiple Fib confluences area. |
| IYR | ||
| IYR Weekly | UP | |
| XLB | 02/09 S | |
| XLB Weekly | UP | BPMATE is way too overbought. |
- Please make sure you understand how to use the table above. The purpose of this report is to provide info so contradictory signals are always presented.
- Conclusions can be confirmed endlessly, but trading wise, you have to take actions at certain risk level as soon as you feel the confirmation is enough. There’s no way for me to adapt to different risk levels therefore no trading signals will be given in this report except the mechanical signals such as SPY ST Model.
- * = New update; Blue Text = Link to a chart in my public chart list.
- Trading signals in OTHER ETFs table are mechanical signals. See HERE for back test results. 08/31 L, for example, means Long on 08/31.
- UP = Intermediate-term uptrend. Set when I see at least one higher high and higher low on daily chart.
- DOWN = Intermediate-term downtrend. Set when I see at least one lower high and lower low on daily chart.


