|
||||||||||||||||||||||||
|
||||||||||||||||||||||||
|
SHORT-TERM: COULD BE A DOWN MONDAY, BUT A LOW OF SOME KIND COULD HAVE BEEN IN
I mentioned 2 possibilities in the Friday’s After Bell Quick Summary, either Shooting Star kissing the broken trend line goodbye or a Head and Shoulders Bottom breakout targeting SPY $131.93. From so far I’ve collected, looks like the argument for Head and Shoulders Bottom is not strong enough, so I’m now inclined to believe a down Monday. However, chances are good that the Friday’s low could be either the final low (means we’ll see a new high soon) or a short-term low (means a rebound will last several days).
The statistics below is the last straw to convince me that we might have a down Monday but a low of some kind could have been in. SPX up while BPSPX down 1+, surprisingly it mostly means a bottom of some kind.
Remember the statistics I mentioned in 02/23 Market Recap about “no 2.5%+ pullback for 40+ trading days, the 1st 2.5%+ pullback could last 4 weeks then 02/18 highs will be revisited”? Well, now the pullback size and time are very close to the averages.
Comparing all the big 2 leg down pullbacks since the March 2009, too, we’re almost there in terms of pullback size and time.
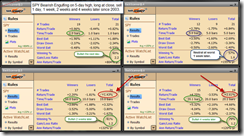
And as per the statistics I mentioned in 03/01 Market Recap about Bearish Engulfing, it should be very bullish in 2 to 4 weeks. Well, 03/01 + 14 = 03/15, which is the next week.
4.1.3 Volatility Index (Weekly), 2 Doji + 1 Shooting Star, VIX weekly looks bearish. A pullback in VIX would translate a higher price in SPX.
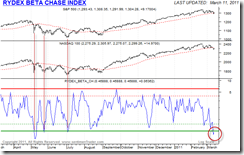
Rydex Beta Chase Index from sentimentrader, retailers are way too bearish which usually means an important bottom.
Last but not the least, still remember the comparison chart in 03/10 Market Recap about impulse down vs corrective down where price mostly overlaps? Still I don’t see any impulse push down, so I really doubt how far the pullback can go.
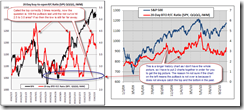
So to summarize above, all blah blah are basically saying that bull has the future. However, there’s one chart, 20 day buy-to-open PC/Ratio, that has successfully caught all the recent tops and bottoms. Now the question is: Will the pullback last until the red curve falls into 2.5 to 3.0 area before it could possibility over? If so, then clearly the pullback is far away from over yet. I’m not sure about the chart yet as according to the longer history, the signal does not always work.
INTERMEDIATE-TERM: COULD NOT BE VERY BRIGHT
On the intermediate-term, I’ll maintain the forecast mentioned in 03/04 Market Recap that we may eventually see a big pullback. The main argument is the OEX Open Interest Ratio is way too high. My guess is the pullback may happen within 2 months because statistically, it seems the market is very bullish in 3 to 6 months.
The statistics below says on a longer time frame (in 3 to 6 months), the market is very bullish. Info only as I cannot see and don’t care that far.
SEASONALITY: BULLISH MONDAY
According to Stock Trader’s Almanac:
- Monday before March Triple Witching, Dow up 17 of last 23.
- March Triple Witching Day mixed last 10 years, Dow down 3 of last 4.
For March seasonality chart please refer to 03/01 Market Recap.
HIGHLIGHTS OF THE OTHER ETFS IN MY PUBLIC CHART LIST
| TREND | COMMENT | |
| QQQQ&Weekly | UP | |
| IWM & Weekly | UP | |
| SSEC & Weekly | UP | |
| EEM & Weekly | *DOWN | |
| XIU & Weekly | UP | 1.5.1 TSE McClellan Oscillator: Oversold. |
| TLT & Weekly | UP | |
| FXE & Weekly | UP | (weekly) Testing Fib confluences area. |
| GLD & Weekly | UP | |
| GDX & Weekly | UP | |
| USO & Weekly | UP | |
| XLE & Weekly | UP | |
| XLF & Weekly | UP | |
| IYR & Weekly | UP | |
| XLB & Weekly | *DOWN | |
| DBA & Weekly | *DOWN |
- Please make sure you understand how to use the table above. The purpose of this report is to provide info so contradictory signals are always presented.
- * = New update; Blue Text = Link to a chart in my public chart list.
- UP = Intermediate-term uptrend. Set when weekly buy signal is triggered.
- DOWN = Intermediate-term downtrend. Set when weekly sell signal is triggered.


